Comprehensive evaluation of ecological environment vulnerability of Yangtze River Delta urban agglomeration based on GIS
-
摘要:
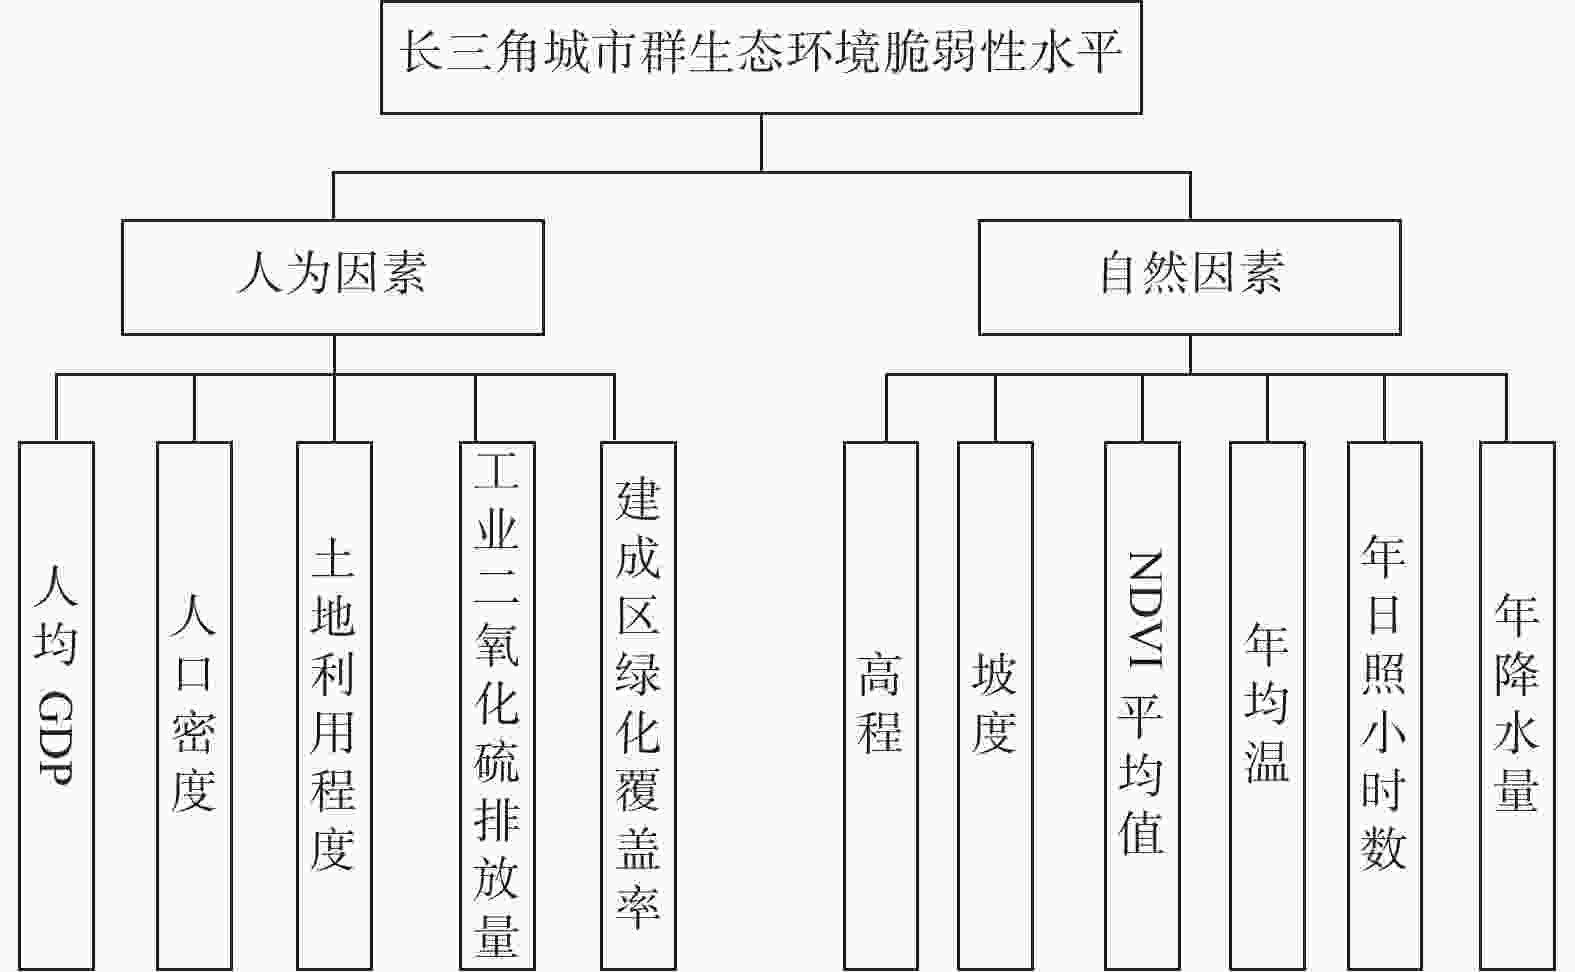
以长三角城市群为例,考虑该地区地表、气候、社会经济发展等特征,从人为因素和自然因素出发构建长三角城市群生态环境脆弱性水平评价指标体系. 同时,基于地学信息系统(Geographic Information System, GIS)技术,综合运用主成分分析、熵权法、空间自相关分析等方法,对长三角城市群2010、2015和2018年生态环境脆弱性水平进行综合测度与时空特征分析,并识别其驱动因素. 结果表明:1)时序分布上,长三角城市群生态环境脆弱性水平升高,且由中度脆弱向重度脆弱过渡;2)空间分布上,生态环境脆弱性存在空间自相关性,且为显著正相关;3)2010—2018年,土地利用程度、人均GDP、工业二氧化硫排放量和建成区绿化覆盖率等是长三角城市群生态环境脆弱性的核心驱动力.
Abstract:Taking the Yangtze River Delta urban agglomeration as an example, the characteristics of the area's surface, climate, and social and economic development were considered, and an evaluation index system for the ecological environment vulnerability of the Yangtze River Delta urban agglomeration from human factors and natural factors was built. At the same time, based on geographic information system (GIS) technology, principal component analysis, entropy weight method, spatial autocorrelation analysis and other methods were used to comprehensively measure and analyze the spatial and temporal characteristics of ecological environmental vulnerability level in the Yangtze River Delta urban agglomeration in 2010, 2015 and 2018, and identify its driving factors. The results show that: 1) in terms of time series distribution, the ecological environment fragility level of the Yangtze River Delta urban agglomeration has increased, and the transition from moderate fragility to severe fragility; 2) in terms of spatial distribution, the vulnerability of ecological environment has spatial autocorrelation, and it is a significant positive correlation; 3) from 2010 to 2018, the degree of land use, GDP per capita, industrial sulfur dioxide emissions, and green coverage of built-up areas are the core driving forces for the fragility of the ecological environment of the Yangtze River Delta urban agglomeration.
-
表 1 评价指标的赋值和标准化
Table 1. Assignment and standardization of evaluation indicators
指标 标准化赋值 2 4 6 8 10 高程 <300 300~<600 600~<900 900~<1200 ≥1200 土地利用程度 林地、水域 草地 耕地 建设用地 未利用土地 表 2 各主成分特征值、贡献率与累计贡献率
Table 2. Characteristic value, contribution rate and cumulative contribution rate of each principal component
年份 主成分系数 主成分 PC1 PC2 PC3 PC4 PC5 2010 特征值 4.587 3.193 1.310 0.531 0.451 贡献率 41.698 29.023 11.905 4.830 4.096 累计贡献率 41.698 70.721 82.626 87.457 91.552 2015 特征值 4.422 2.945 1.170 0.726 0.574 贡献率 40.197 26.774 10.640 6.598 5.215 累计贡献率 40.197 66.971 77.610 84.208 89.423 2018 特征值 4.395 2.693 1.225 0.784 0.551 贡献率 39.956 24.482 11.139 7.130 5.010 累计贡献率 39.956 64.438 75.577 82.706 87.717 表 3 2010年成分矩阵
Table 3. Composition matrix in 2010
指标 主成分 PC1 PC2 PC3 PC4 PC5 高程 −0.893 0.236 −0.201 0.190 0.114 土地利用程度 0.870 −0.144 0.295 0.124 −0.057 年降水量 −0.838 0.282 0.184 −0.030 −0.323 坡度 −0.697 0.447 −0.375 0.292 0.207 人均GDP 0.565 0.544 −0.484 −0.240 0.070 工业二氧化硫排放量 0.507 0.766 0.034 0.172 0.156 年日照小时数 0.265 −0.747 −0.408 −0.083 0.272 年均温 0.521 −0.705 0.089 0.347 0.049 人口密度 0.546 0.678 0.291 0.281 0.029 NDVI平均值 0.618 0.661 −0.048 −0.220 0.005 建成区绿化覆盖率 −0.496 0.048 0.715 −0.227 0.425 表 4 2018年成分矩阵
Table 4. Composition matrix in 2018
指标 主成分 PC1 PC2 PC3 PC4 PC5 高程 −0.943 0.010 −0.130 −0.057 0.135 土地利用程度 0.875 0.042 0.167 −0.122 −0.206 坡度 −0.805 0.253 −0.218 −0.278 0.259 降水量 −0.665 0.386 0.270 0.220 −0.079 年均温 0.660 −0.610 −0.085 −0.014 −0.045 人均GDP 0.436 0.757 −0.215 −0.014 0.139 NDVI平均值 0.610 0.705 0.067 0.069 0.062 工业二氧化硫排放量 0.229 0.635 −0.443 0.493 −0.019 人口密度 0.430 0.578 0.449 −0.429 0.214 建成区绿化覆盖率 −0.424 0.148 0.761 0.323 −0.057 年日照小时数 0.486 −0.526 0.155 0.322 0.585 -
[1] 屈志强, 沈婷婷, 徐胜利, 等. 生态脆弱性评价概述[J] . 草原与草业,2020,32(3):1 − 4,42. doi: 10.3969/j.issn.2095-5952.2020.03.002 [2] 张学玲, 余文波, 蔡海生, 等. 区域生态环境脆弱性评价方法研究综述[J] . 生态学报,2018,38(16):5970 − 5981. [3] 邓伟, 袁兴中, 孙荣, 等. 基于遥感的北方农牧交错带生态脆弱性评价[J] . 环境科学与技术,2016,39(11):174 − 181. [4] 张德君, 高航, 杨俊, 等. 基于GIS的南四湖湿地生态脆弱性评价[J] . 资源科学,2014,36(4):874 − 882. [5] 姚昆, 张存杰, 何磊, 等. 川西北高原区生态环境脆弱性评价[J] . 水土保持研究,2020,27(0):349 − 355,362. [6] 姚昆, 周兵, 李小菊, 等. 基于AHP−PCA熵权模型的大渡河流域中上游地区生态环境脆弱性评价[J] . 水土保持研究,2019,26(5):265 − 271. [7] 何云玲. GIS支持下生态环境脆弱性评价研究概况[J] . 农业与技术,2008(3):65 − 68. doi: 10.3969/j.issn.1671-962X.2008.03.019 [8] 钟晓娟, 孙保平, 赵岩, 等. 基于主成分分析的云南省生态脆弱性评价[J] . 生态环境学报,2011,20(1):109 − 113. doi: 10.3969/j.issn.1674-5906.2011.01.019 [9] 高越, 赵秀清, 朝格吉胡楞, 等. 基于主成分分析法的赤峰市生态环境质量评价[J] . 内蒙古科技与经济,2017(14):58 − 59,61. doi: 10.3969/j.issn.1007-6921.2017.14.031 [10] 马骏, 李昌晓, 魏虹, 等. 三峡库区生态脆弱性评价[J] . 生态学报,2015,35(21):7117 − 7129. [11] 陈星霖. 广西农业生态脆弱性评价及区划研究[J] . 中国农业资源与区划,2020,41(3):212 − 219. [12] 李路, 孙桂丽, 陆海燕, 等. 喀什地区生态脆弱性时空变化及驱动力分析[J] . 干旱区地理,2021(1):277 − 288. [13] 杨志辉, 赵军, 朱国锋, 等. 含植被覆盖影响的石羊河流域土壤水分遥感估算及空间格局分析[J] . 生态学报,2020,40(23):8826 − 8837. [14] 刘木生, 张其海, 林联盛, 等. 基于GIS的江西省脆弱生态环境时空评价[J] . 江西科学,2008(5):803 − 807,811. doi: 10.3969/j.issn.1001-3679.2008.05.038 [15] 林金煌, 胡国建, 祁新华, 等. 闽三角城市群生态环境脆弱性及其驱动力[J] . 生态学报,2018,38(12):4155 − 4166. [16] 南颖, 吉喆, 冯恒栋, 等. 基于遥感和地理信息系统的图们江地区生态安全评价[J] . 生态学报,2013,33(15):4790 − 4798. [17] 杜悦悦, 彭建, 赵士权, 等. 西南山地滑坡灾害生态风险评价:以大理白族自治州为例[J] . 地理学报,2016,71(9):1544 − 1561. doi: 10.11821/dlxb201609007 [18] 杨宇. 多指标综合评价中赋权方法评析[J] . 统计与决策,2006(13):17 − 19. doi: 10.3969/j.issn.1002-6487.2006.13.010 [19] 胡庆芳, 杨大文, 王银堂, 等. 利用全局与局部相关函数分析流域降水空间变异性[J] . 清华大学学报(自然科学版),2012,52(6):778 − 784. [20] 李慧, 王云鹏, 李岩, 等. 珠江三角洲土地利用变化空间自相关分析[J] . 生态环境学报,2011,20(12):1879 − 1885. [21] 朱子明 , 祁新华. 基于 Moran'I 的闽南三角洲空间发展研究[J] . 经济地理,2009(2):1977 − 1980. [22] 钱敏蕾, 李响, 徐艺扬, 等. 特大型城市生态文明建设评价指标体系构建:以上海市为例[J] . 复旦学报(自然科学版),2015,54(4):389 − 397. -


 下载:
下载:


