Optimization design and simulation evaluation of traffic organization at level intersection
-
摘要:
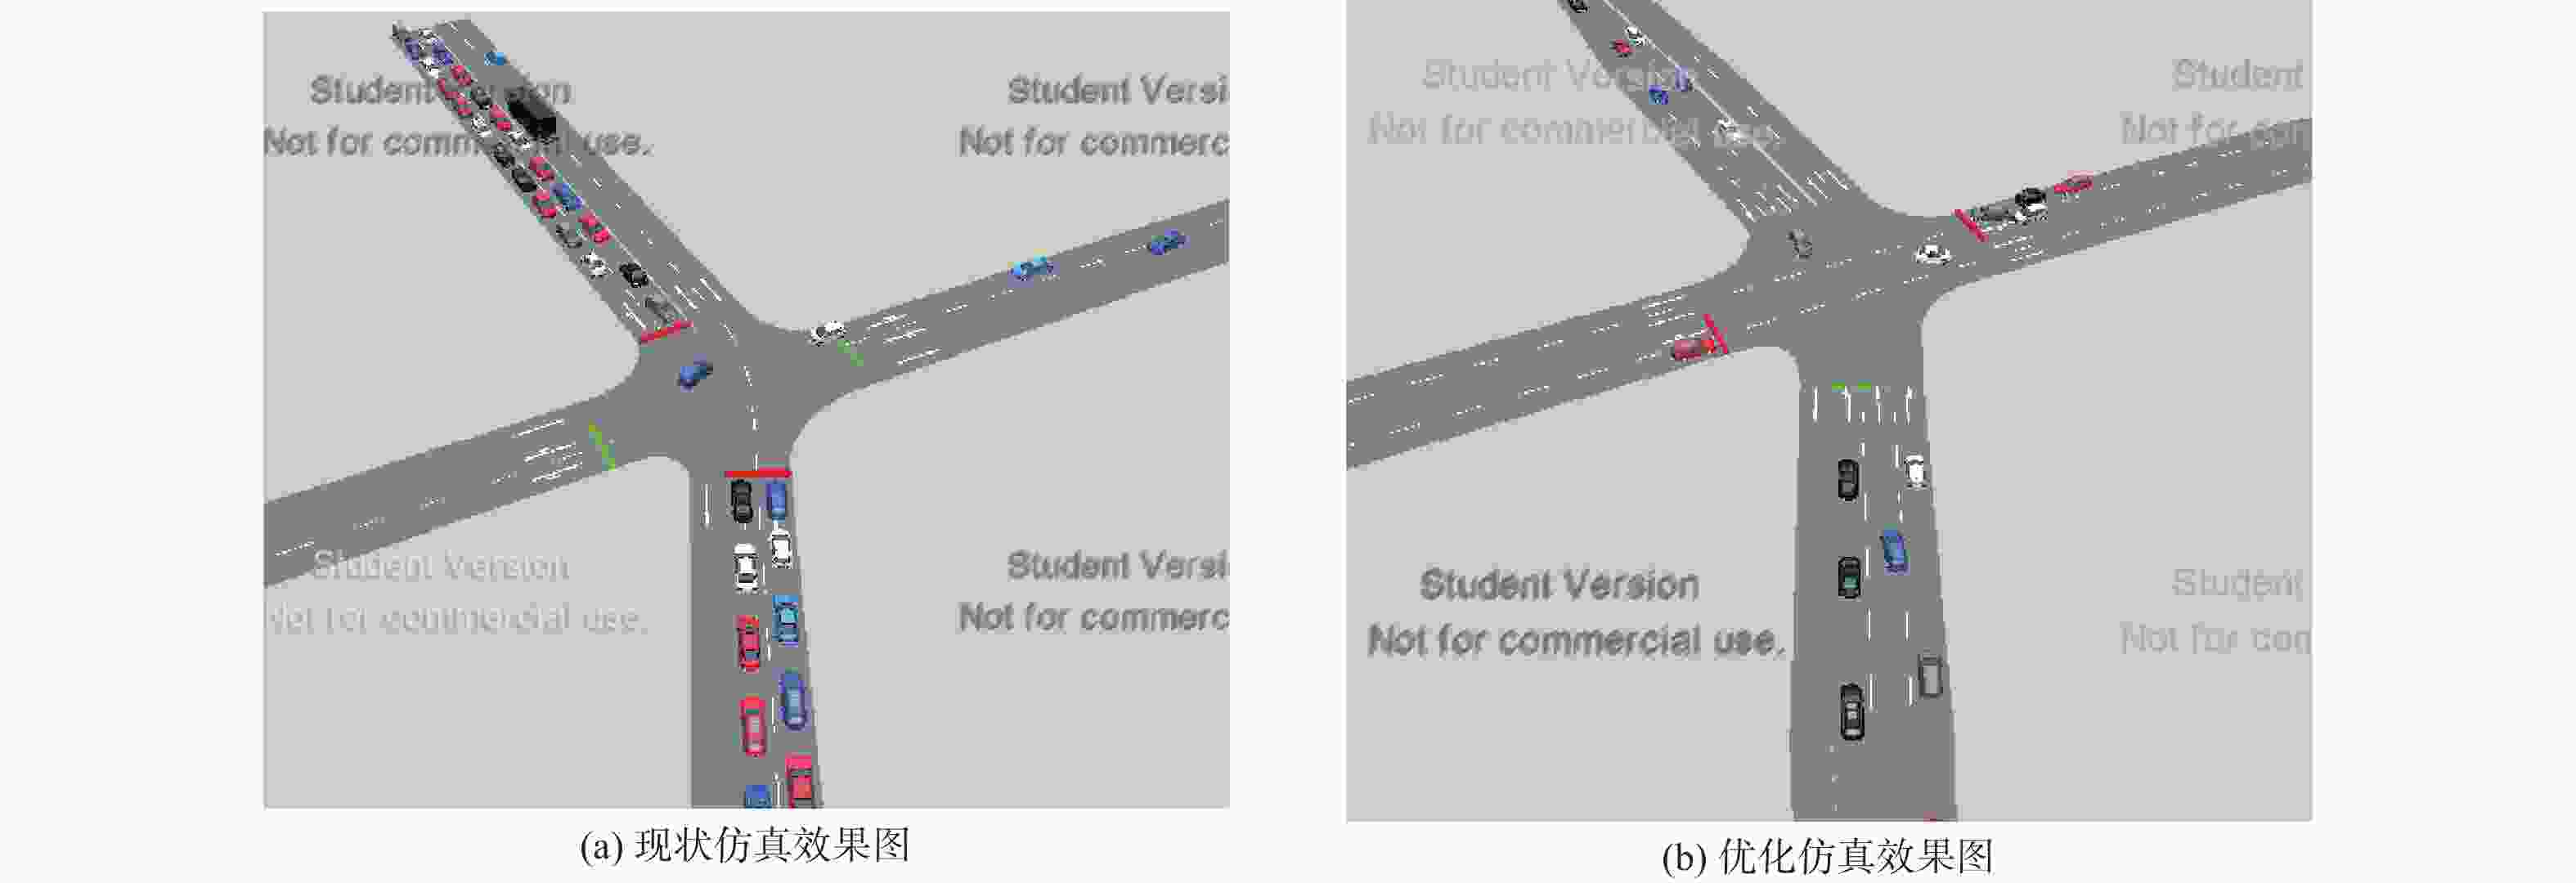
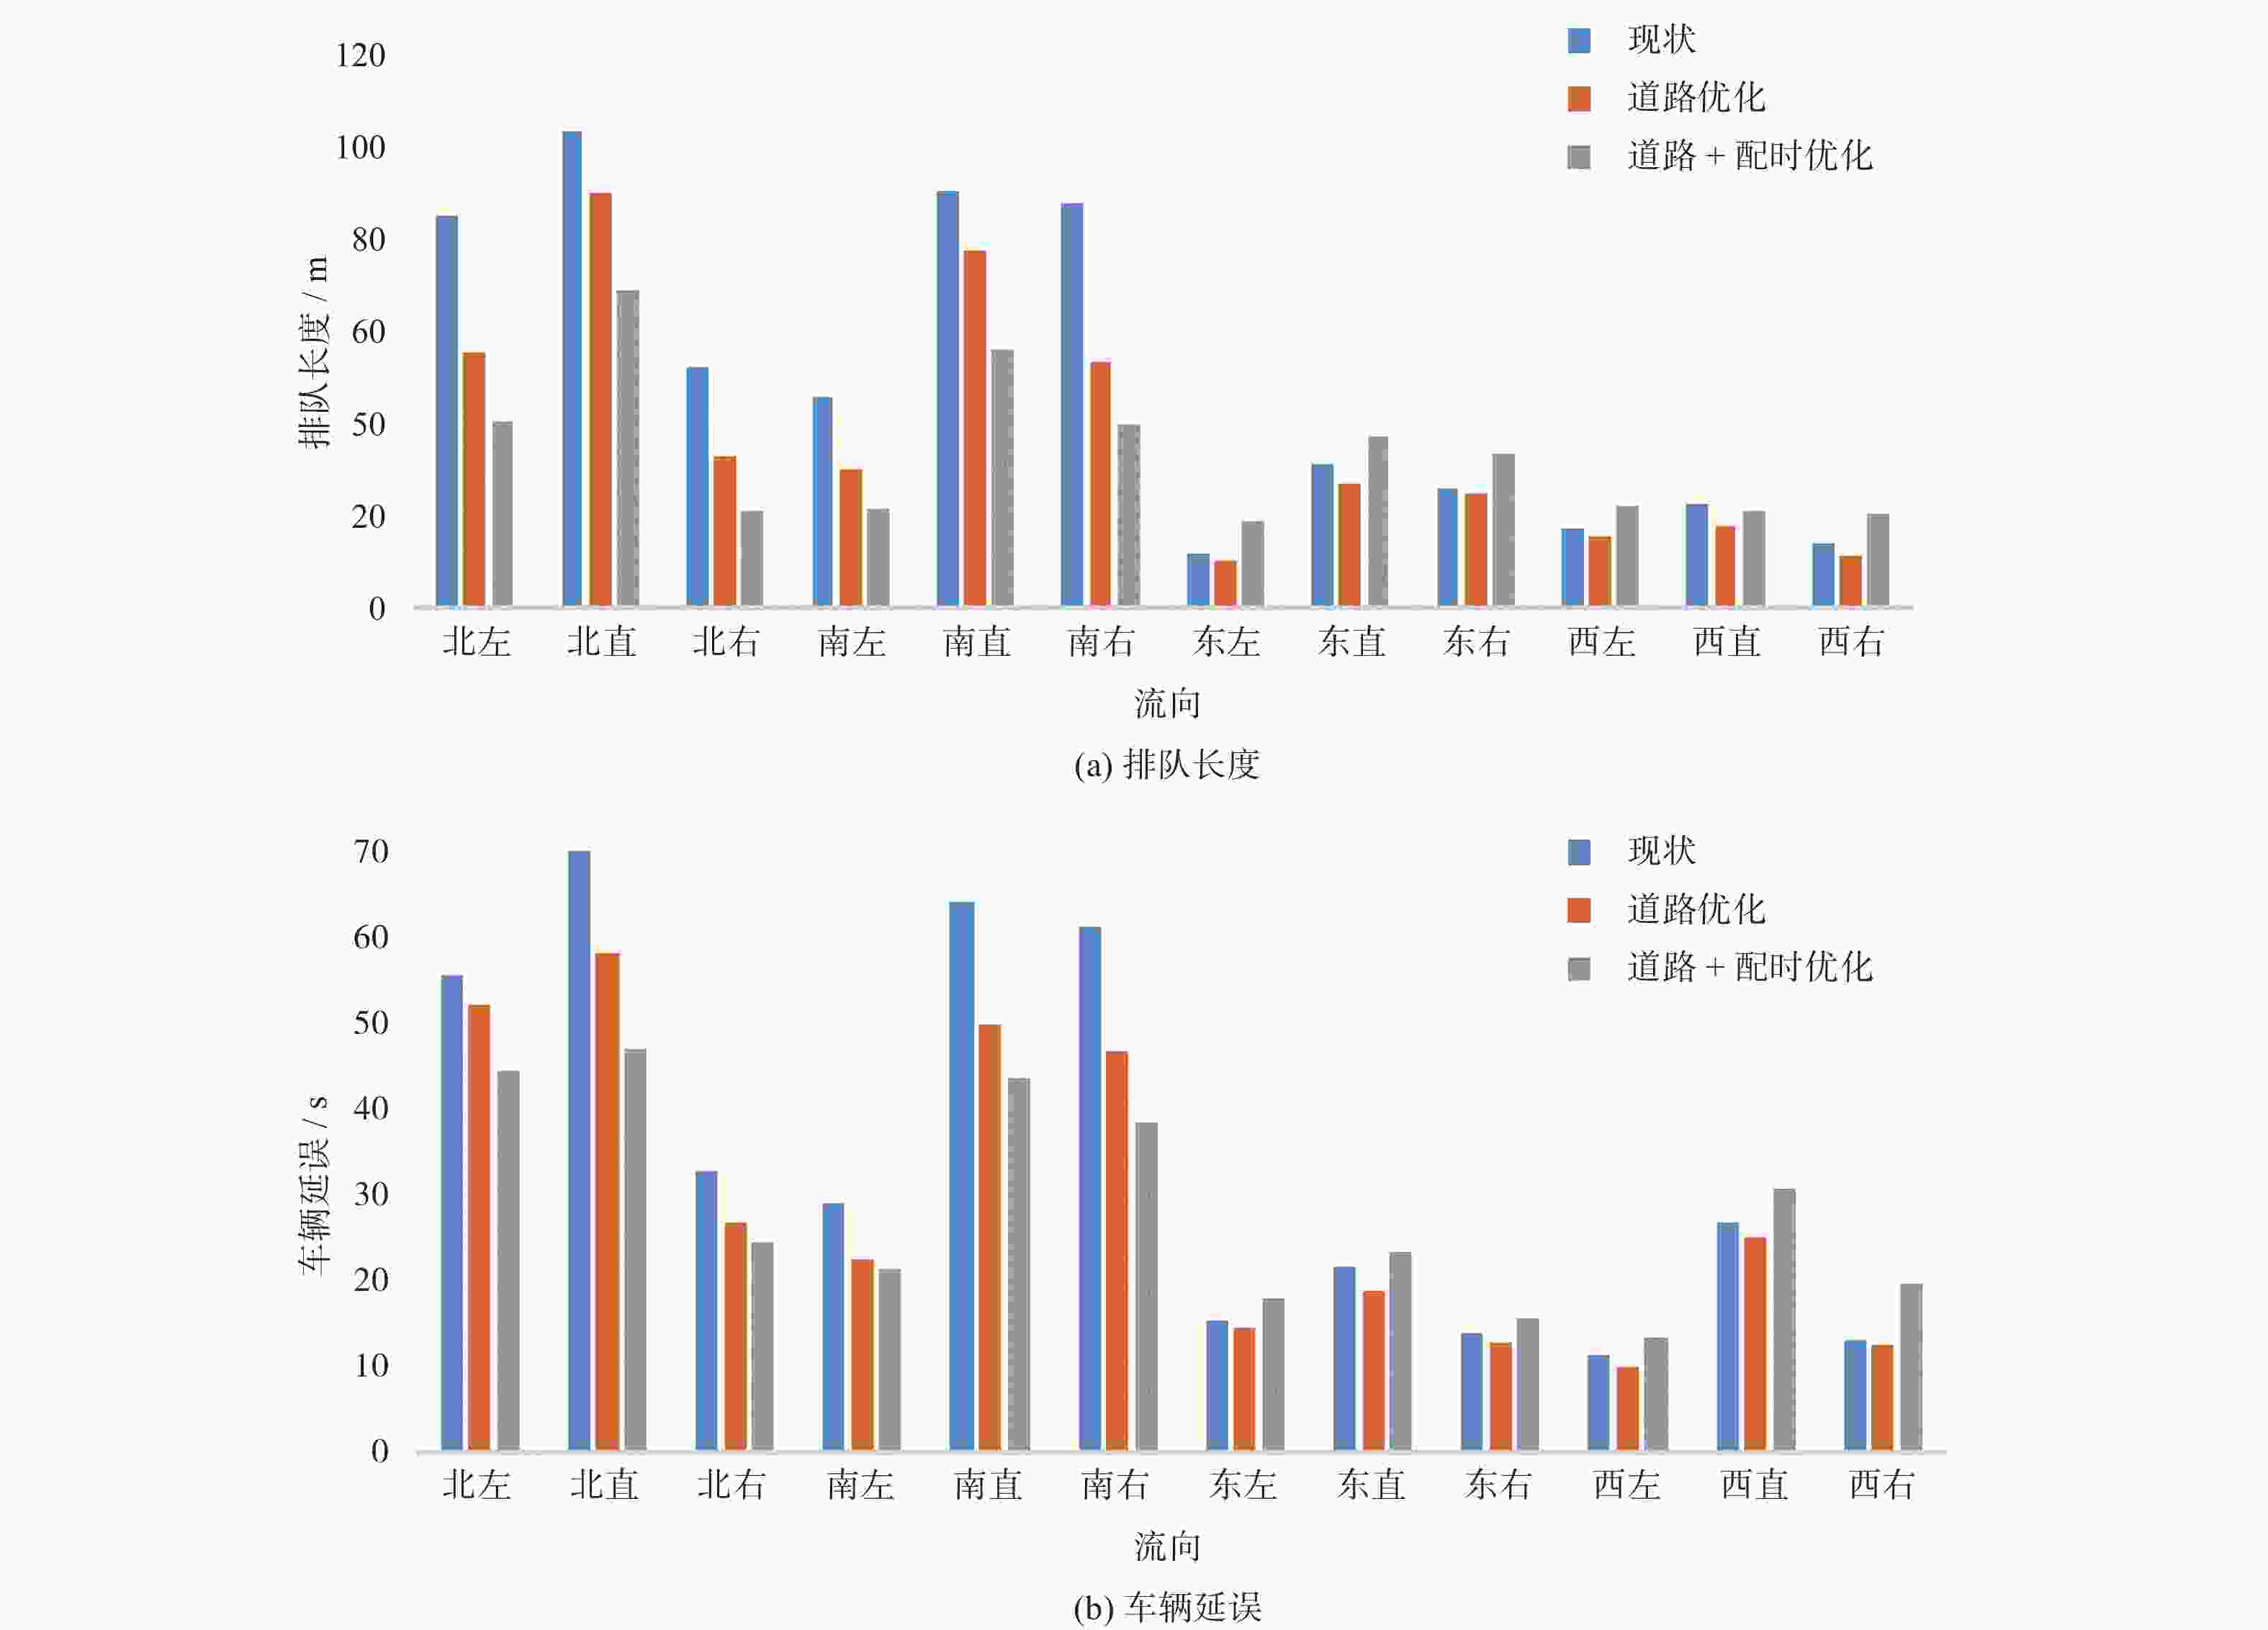
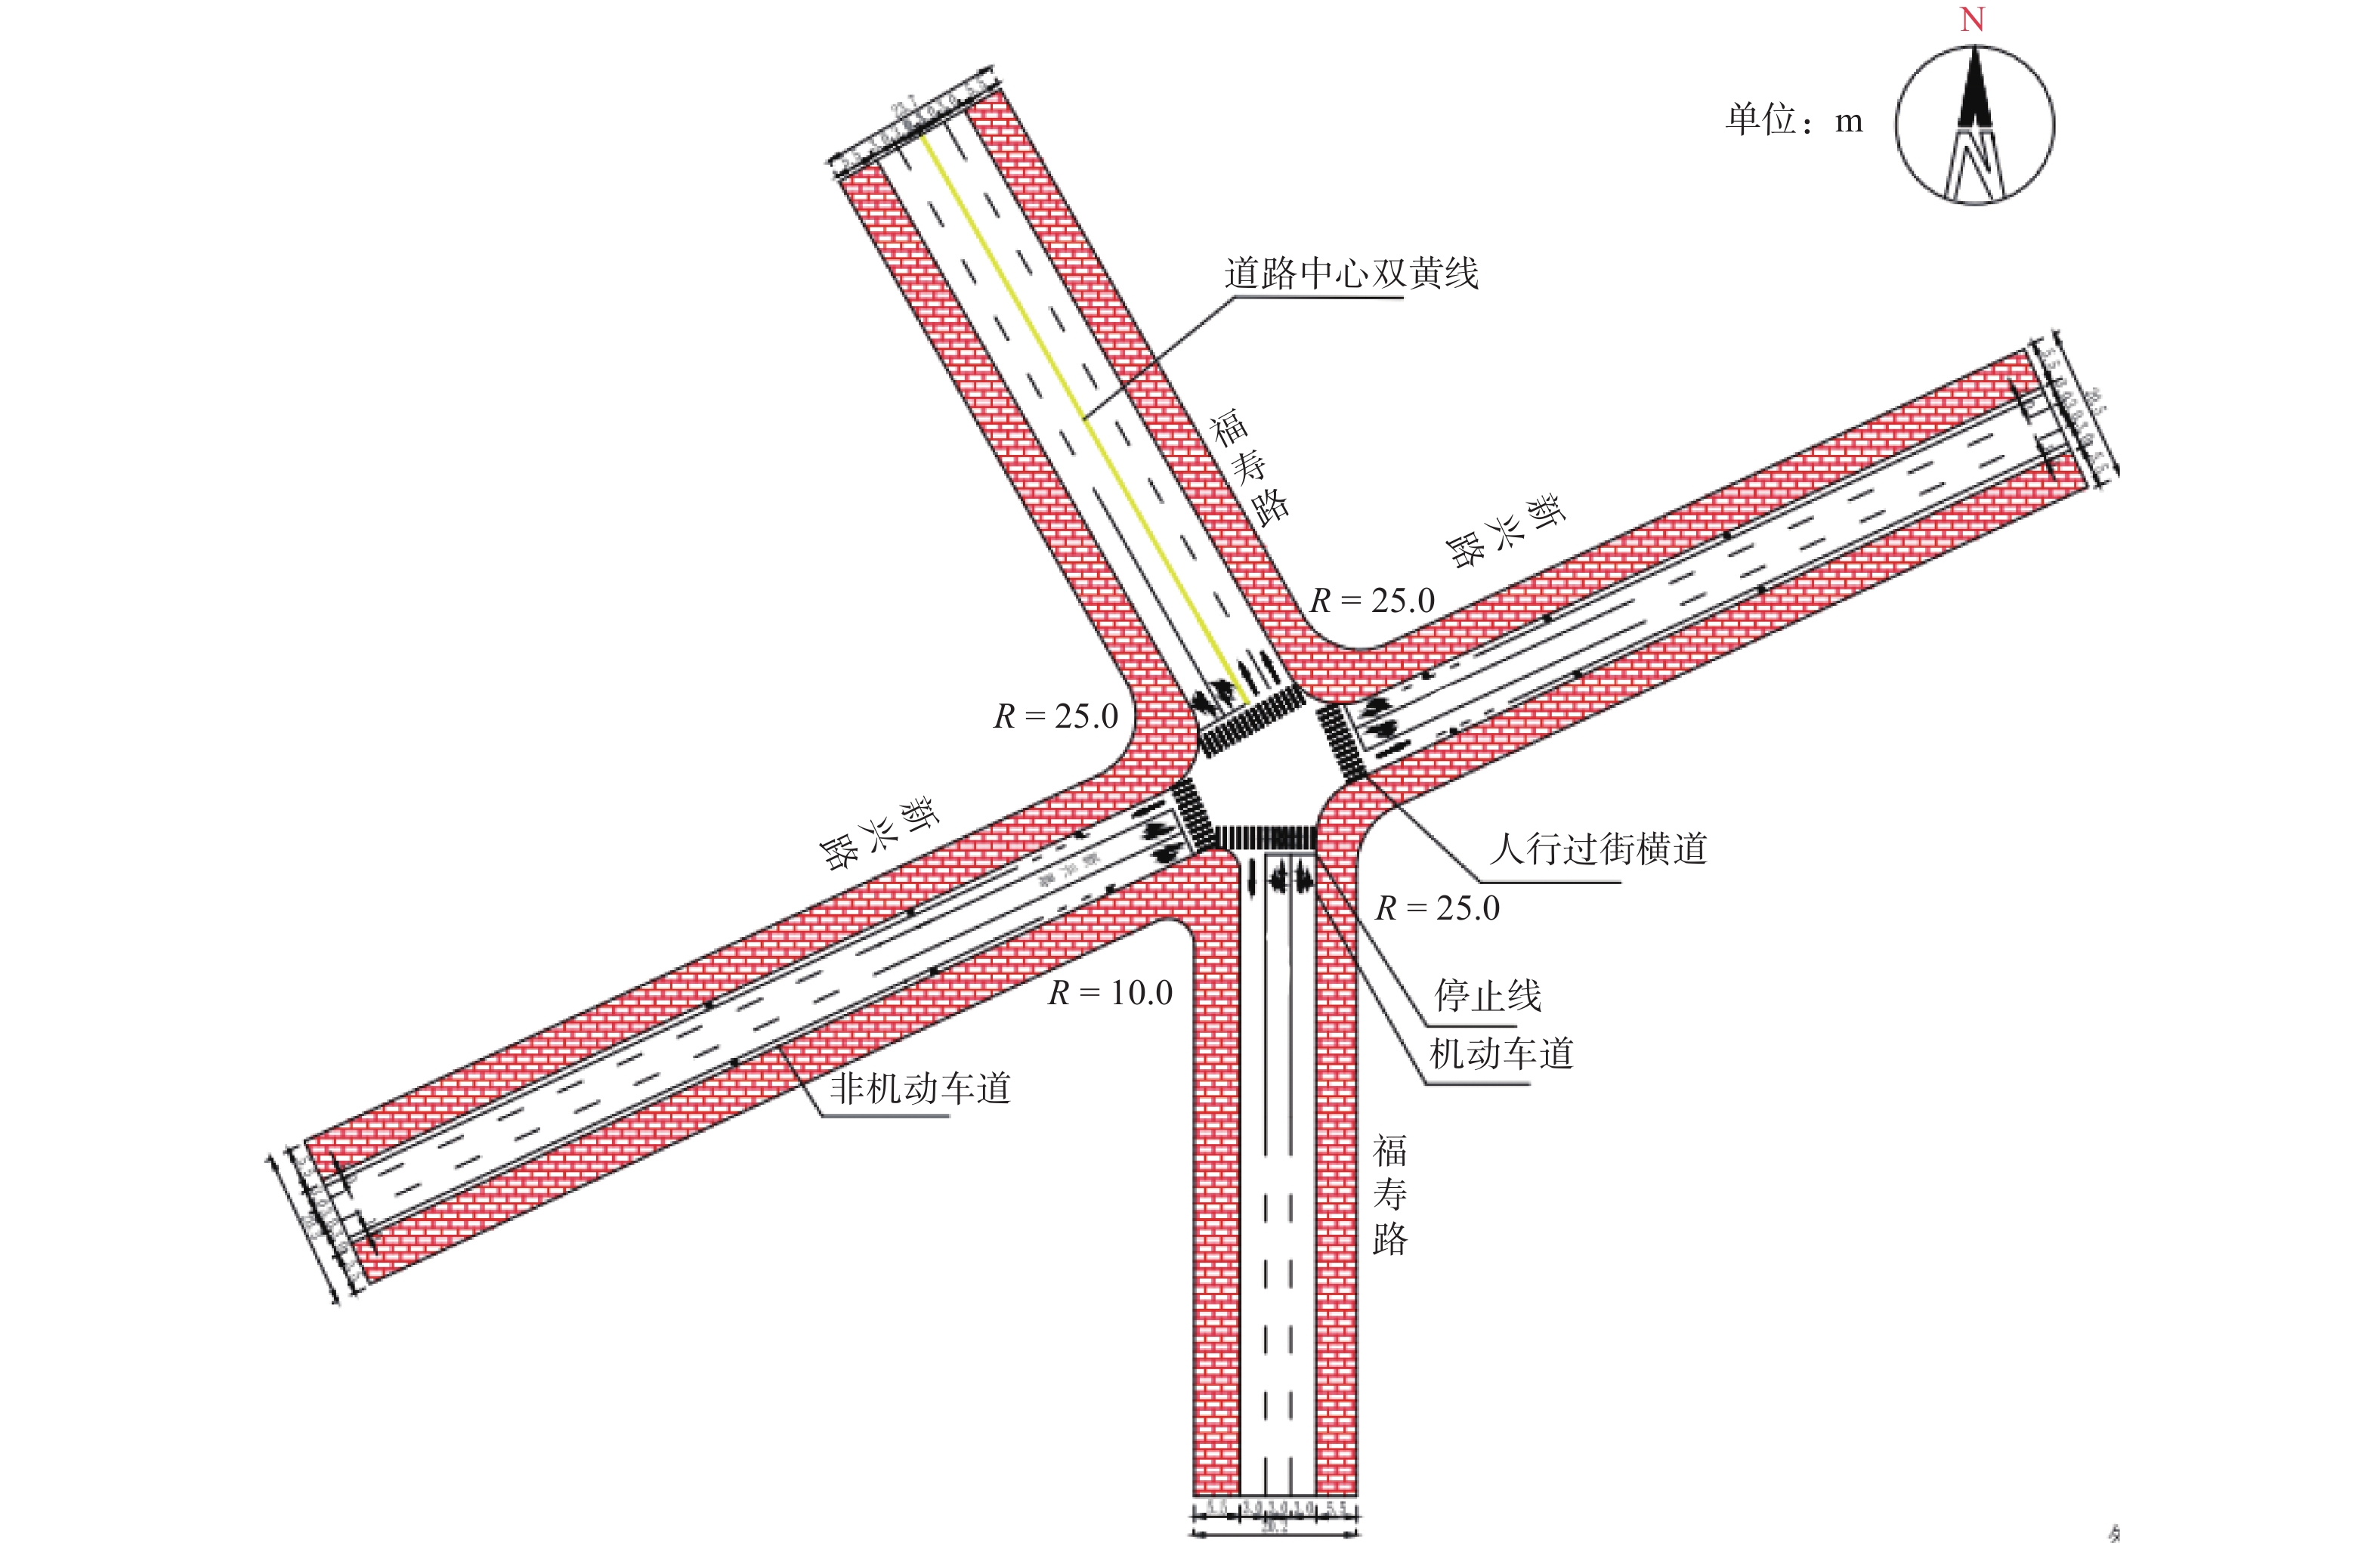
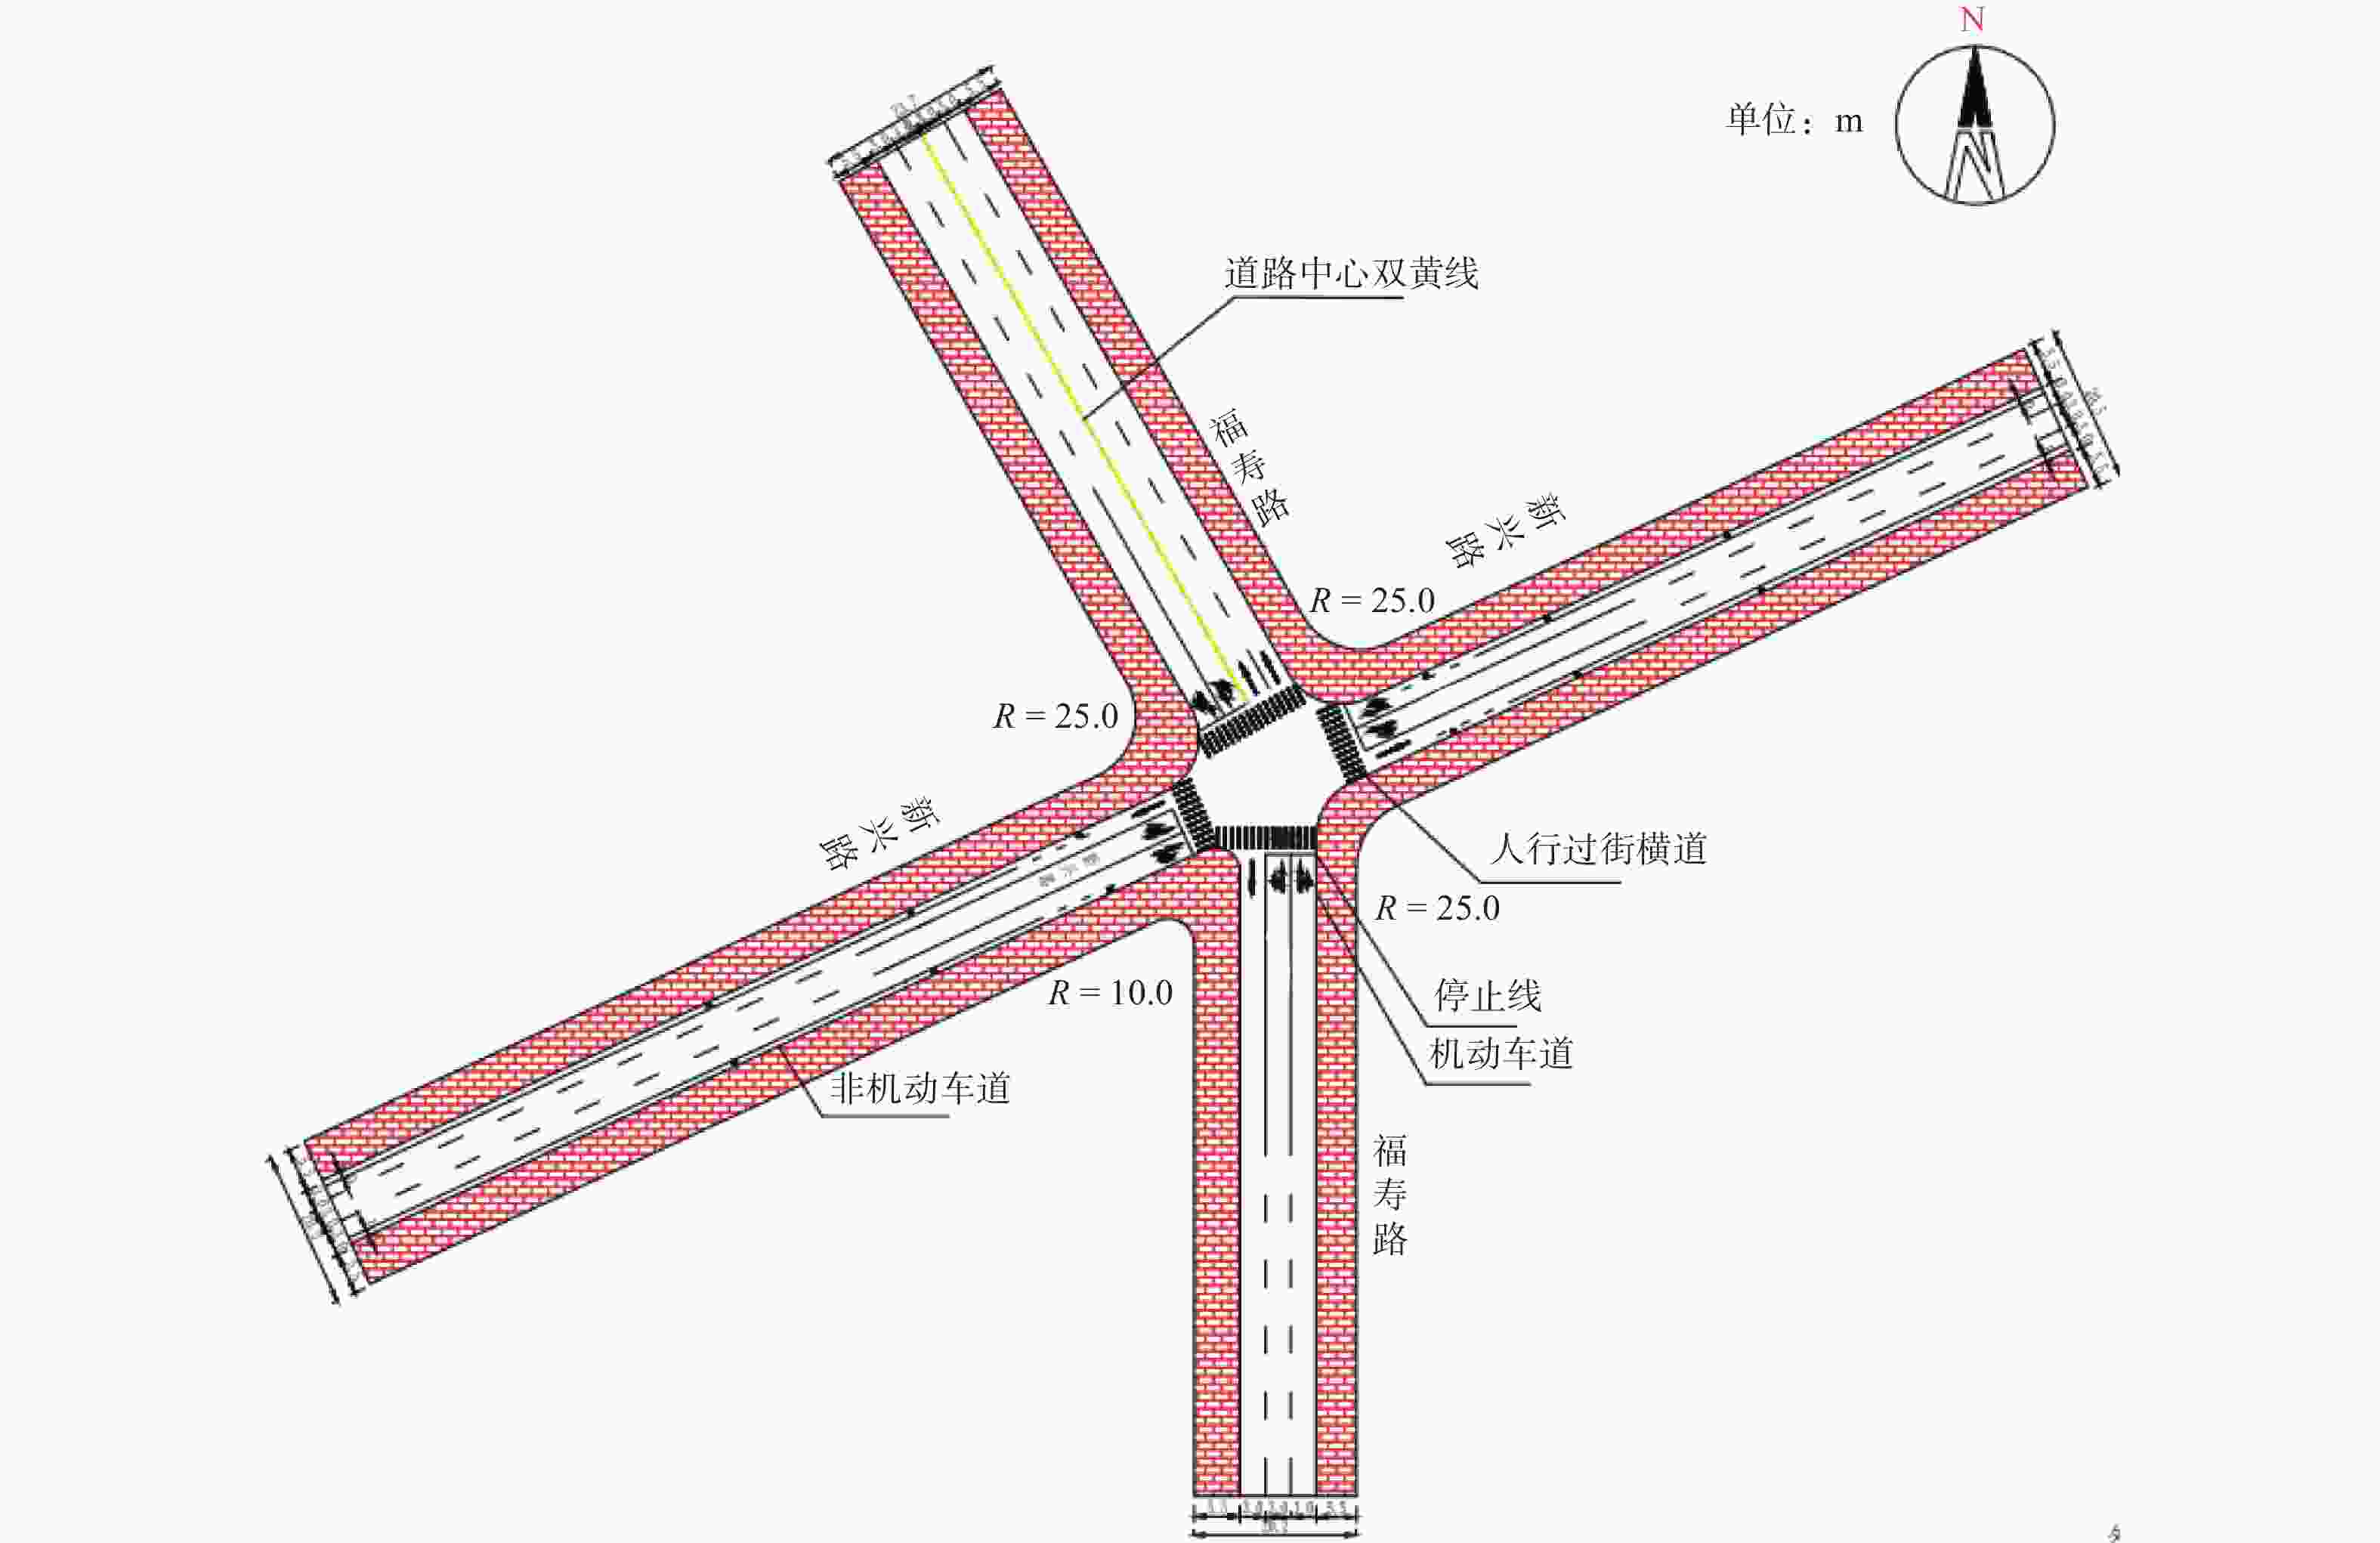
平面交叉口作为交通体系的构成因素,是交通中最易导致交通拥挤和交通事故的结点. 基于辽源市福寿路与新兴路平面交叉口的交通组织现状调查以及拥堵原因分析,对福寿路与新兴路交叉口进行道路渠化以及信号配时相位优化,采用通行能力、饱和度、服务水平、排队长度及车辆延误等指标进行评价分析,并利用VISSIM仿真对该方案进行验证. 结果表明,优化方案交叉口通行能力提升43.78%,饱和度下降45.04%,服务水平提升至二级,车辆延误下降33.01%,排队最大长度下降33.63%,辽源市福寿路与新兴路交叉口交通状况得到改善,论证了该方案的有效性.
Abstract:As a component of traffic system, the level intersection is the node most likely to cause traffic congestion and traffic accidents. Based on the causes of congestion and the current traffic organization survey of the level intersection of Fushou Road and Xinxing Road in Liaoyuan City, were the road canalization and the optimization of signal timing phase for the intersection of Fushou Road and Xinxing Road were conducted. Indicators such as capacity, saturation, service level, queue length and vehicle delay were used for evaluation and analysis, and VISSIM simulation was used to verify the scheme. The results show that the intersection capacity of the optimized scheme was improved by 43.78%. The saturation level decreased by 45.04%. The level of service was improved to level 2. Vehicle delays decreased by 33.01%. The maximum queue length decreased by 33.63%. The traffic condition at the intersection of Fushou Road and Xinxing Road in Liaoyuan City was improved, which can demonstrate the effectiveness of the scheme.
-
表 1 信号交叉口服务水平评价标准
Table 1. Service level evaluation criteria for signaled intersections
指标 服务水平 一级 二级 三级 四级 控制延误/(s∙veh−1) ≤ 30 >30~50 >50~60 > 60 负荷度 ≤ 0.6 >0.6~0.8 >0.8~0.9 > 0.9 排队长度/m ≤ 30 >30~80 >80~100 > 100 表 2 交叉口各进口道车道布置情况
Table 2. Layout of each inlet lane at intersection
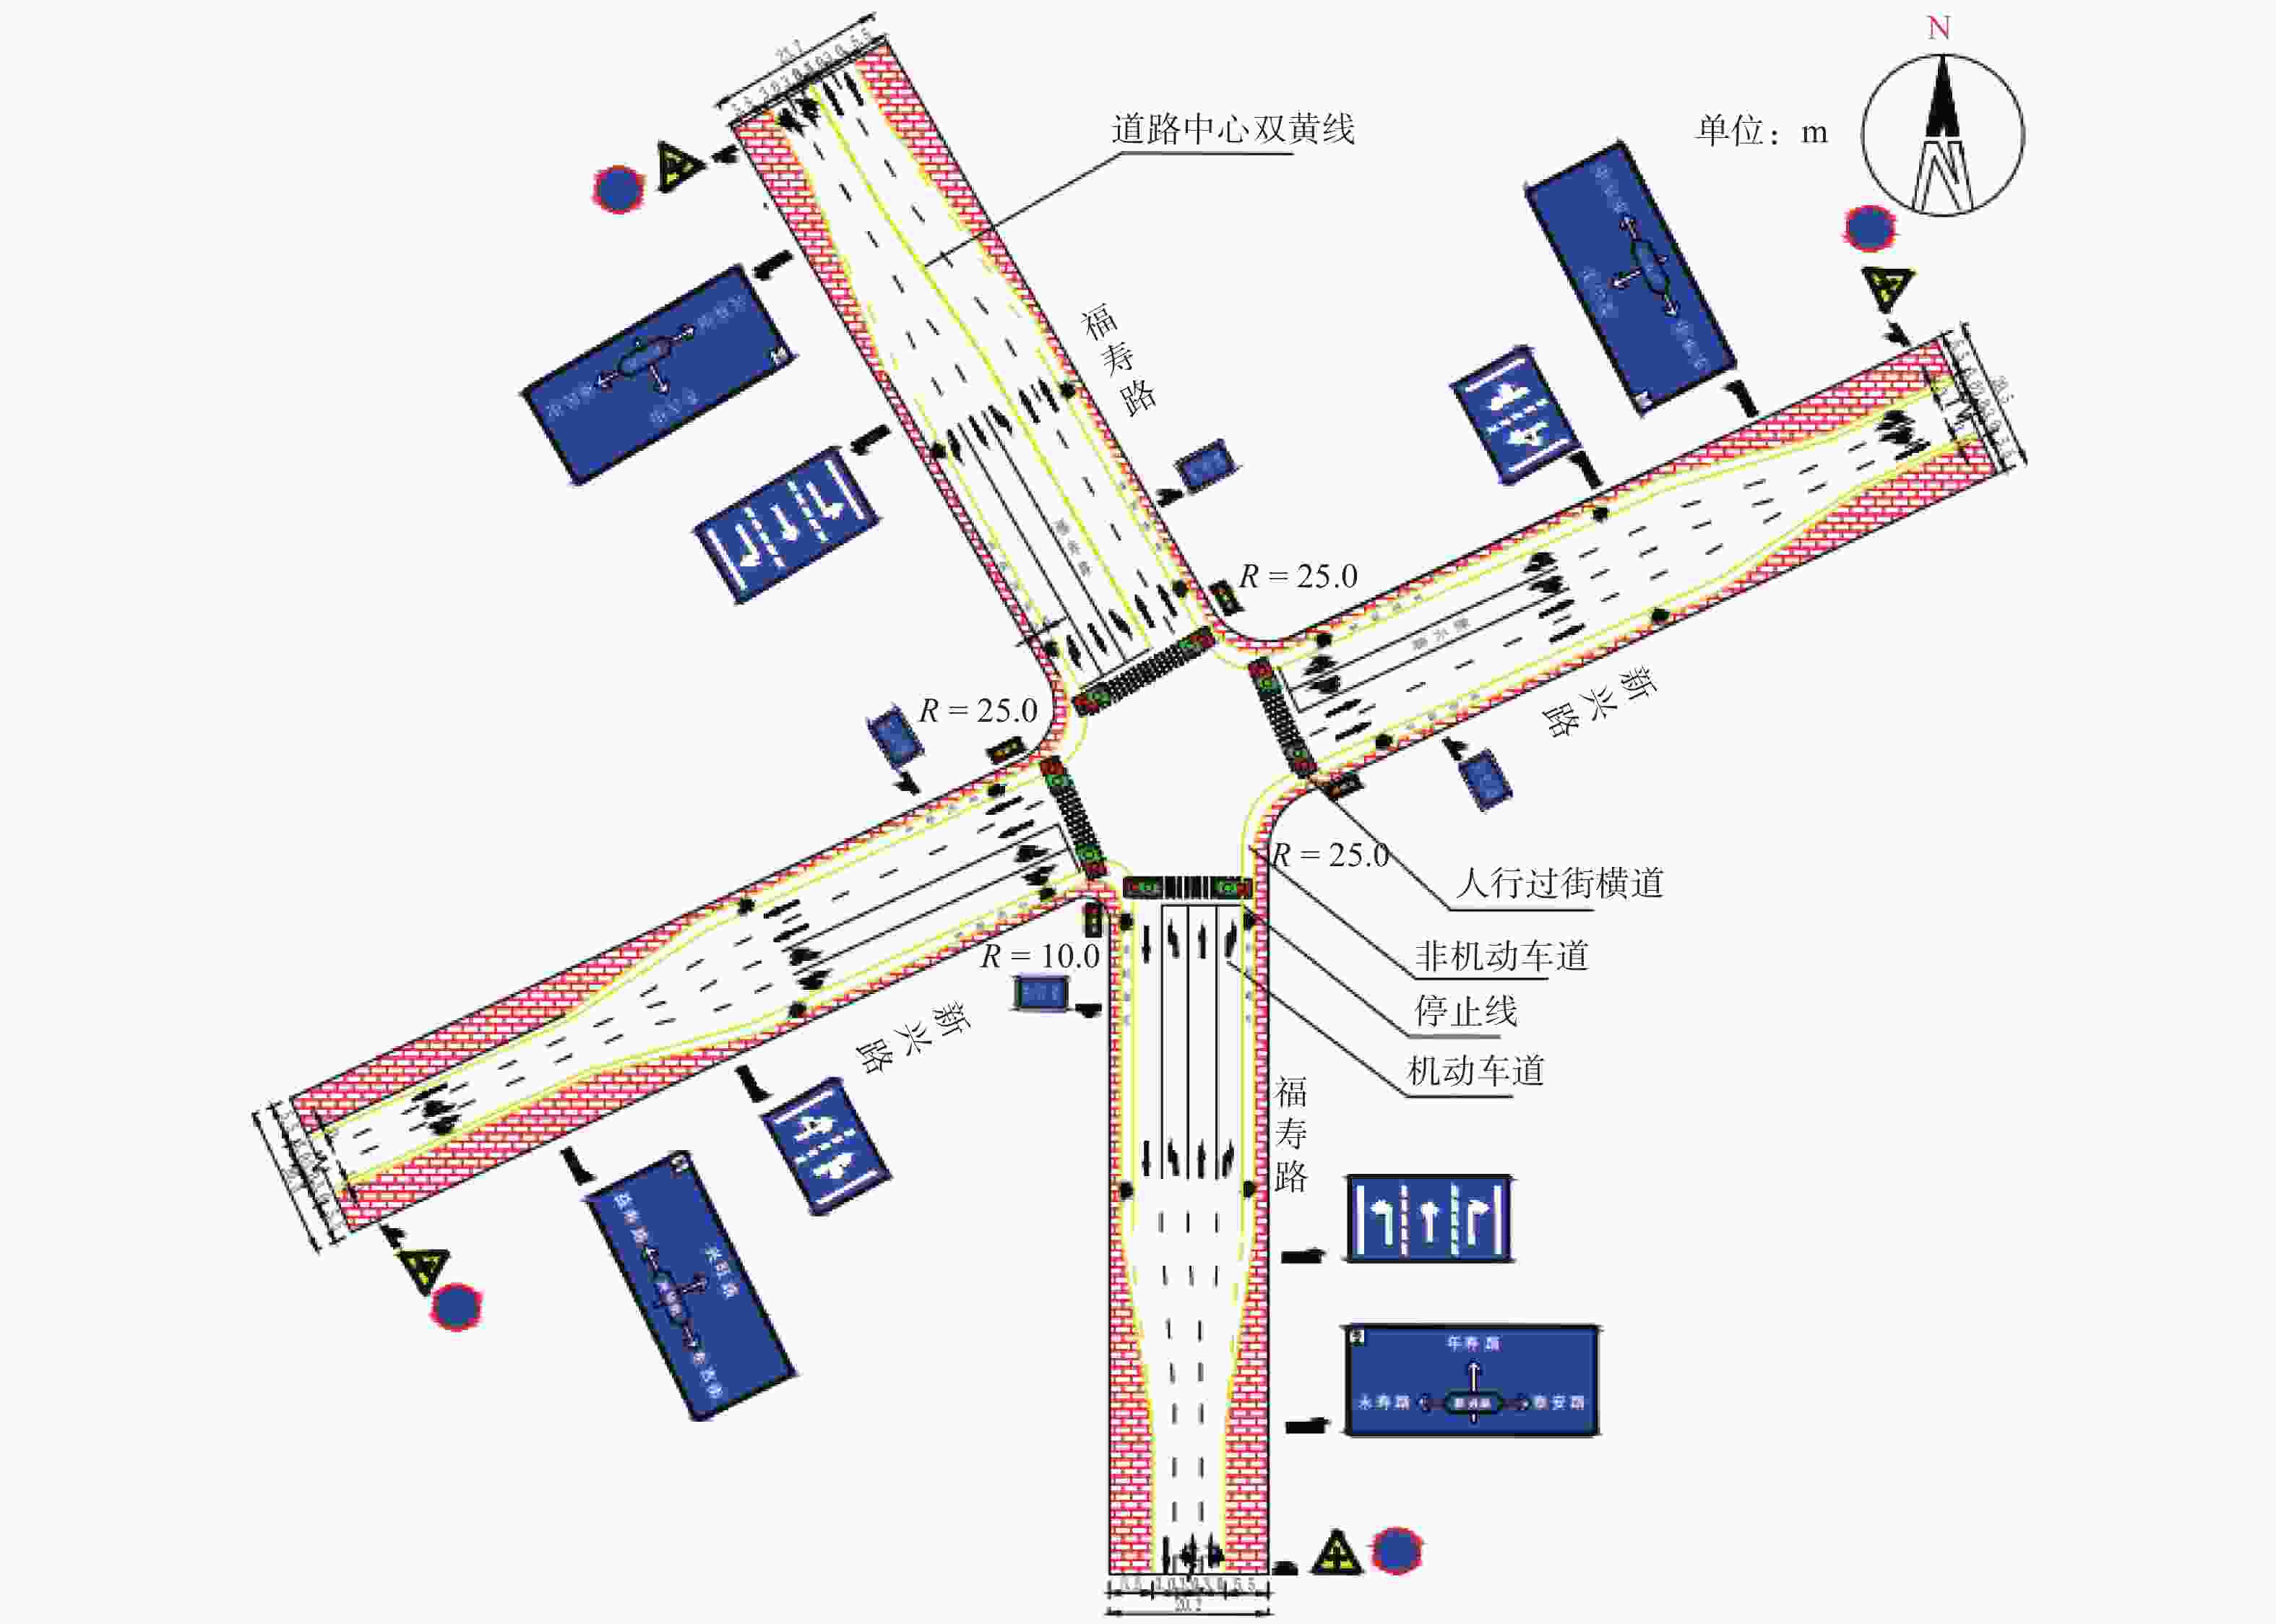
进口道 转向 车道数 宽度/m 流量/(pcu·h−1) 总流量/(pcu·h−1) 南进口 左转 1 3 512 1088 直行 2 3 680 右转 1 3 680 北进口 左转 1 3 632 1938 直行 2 3 782 右转 1 3 524 西进口 左转 1 3 148 468 直行 2 3 196 右转 1 3 124 东进口 左转 1 3 104 644 直行 2 3 280 右转 1 3 260 表 3 现状交叉口各进口道概况
Table 3. Situation of each inlet lane at current intersection
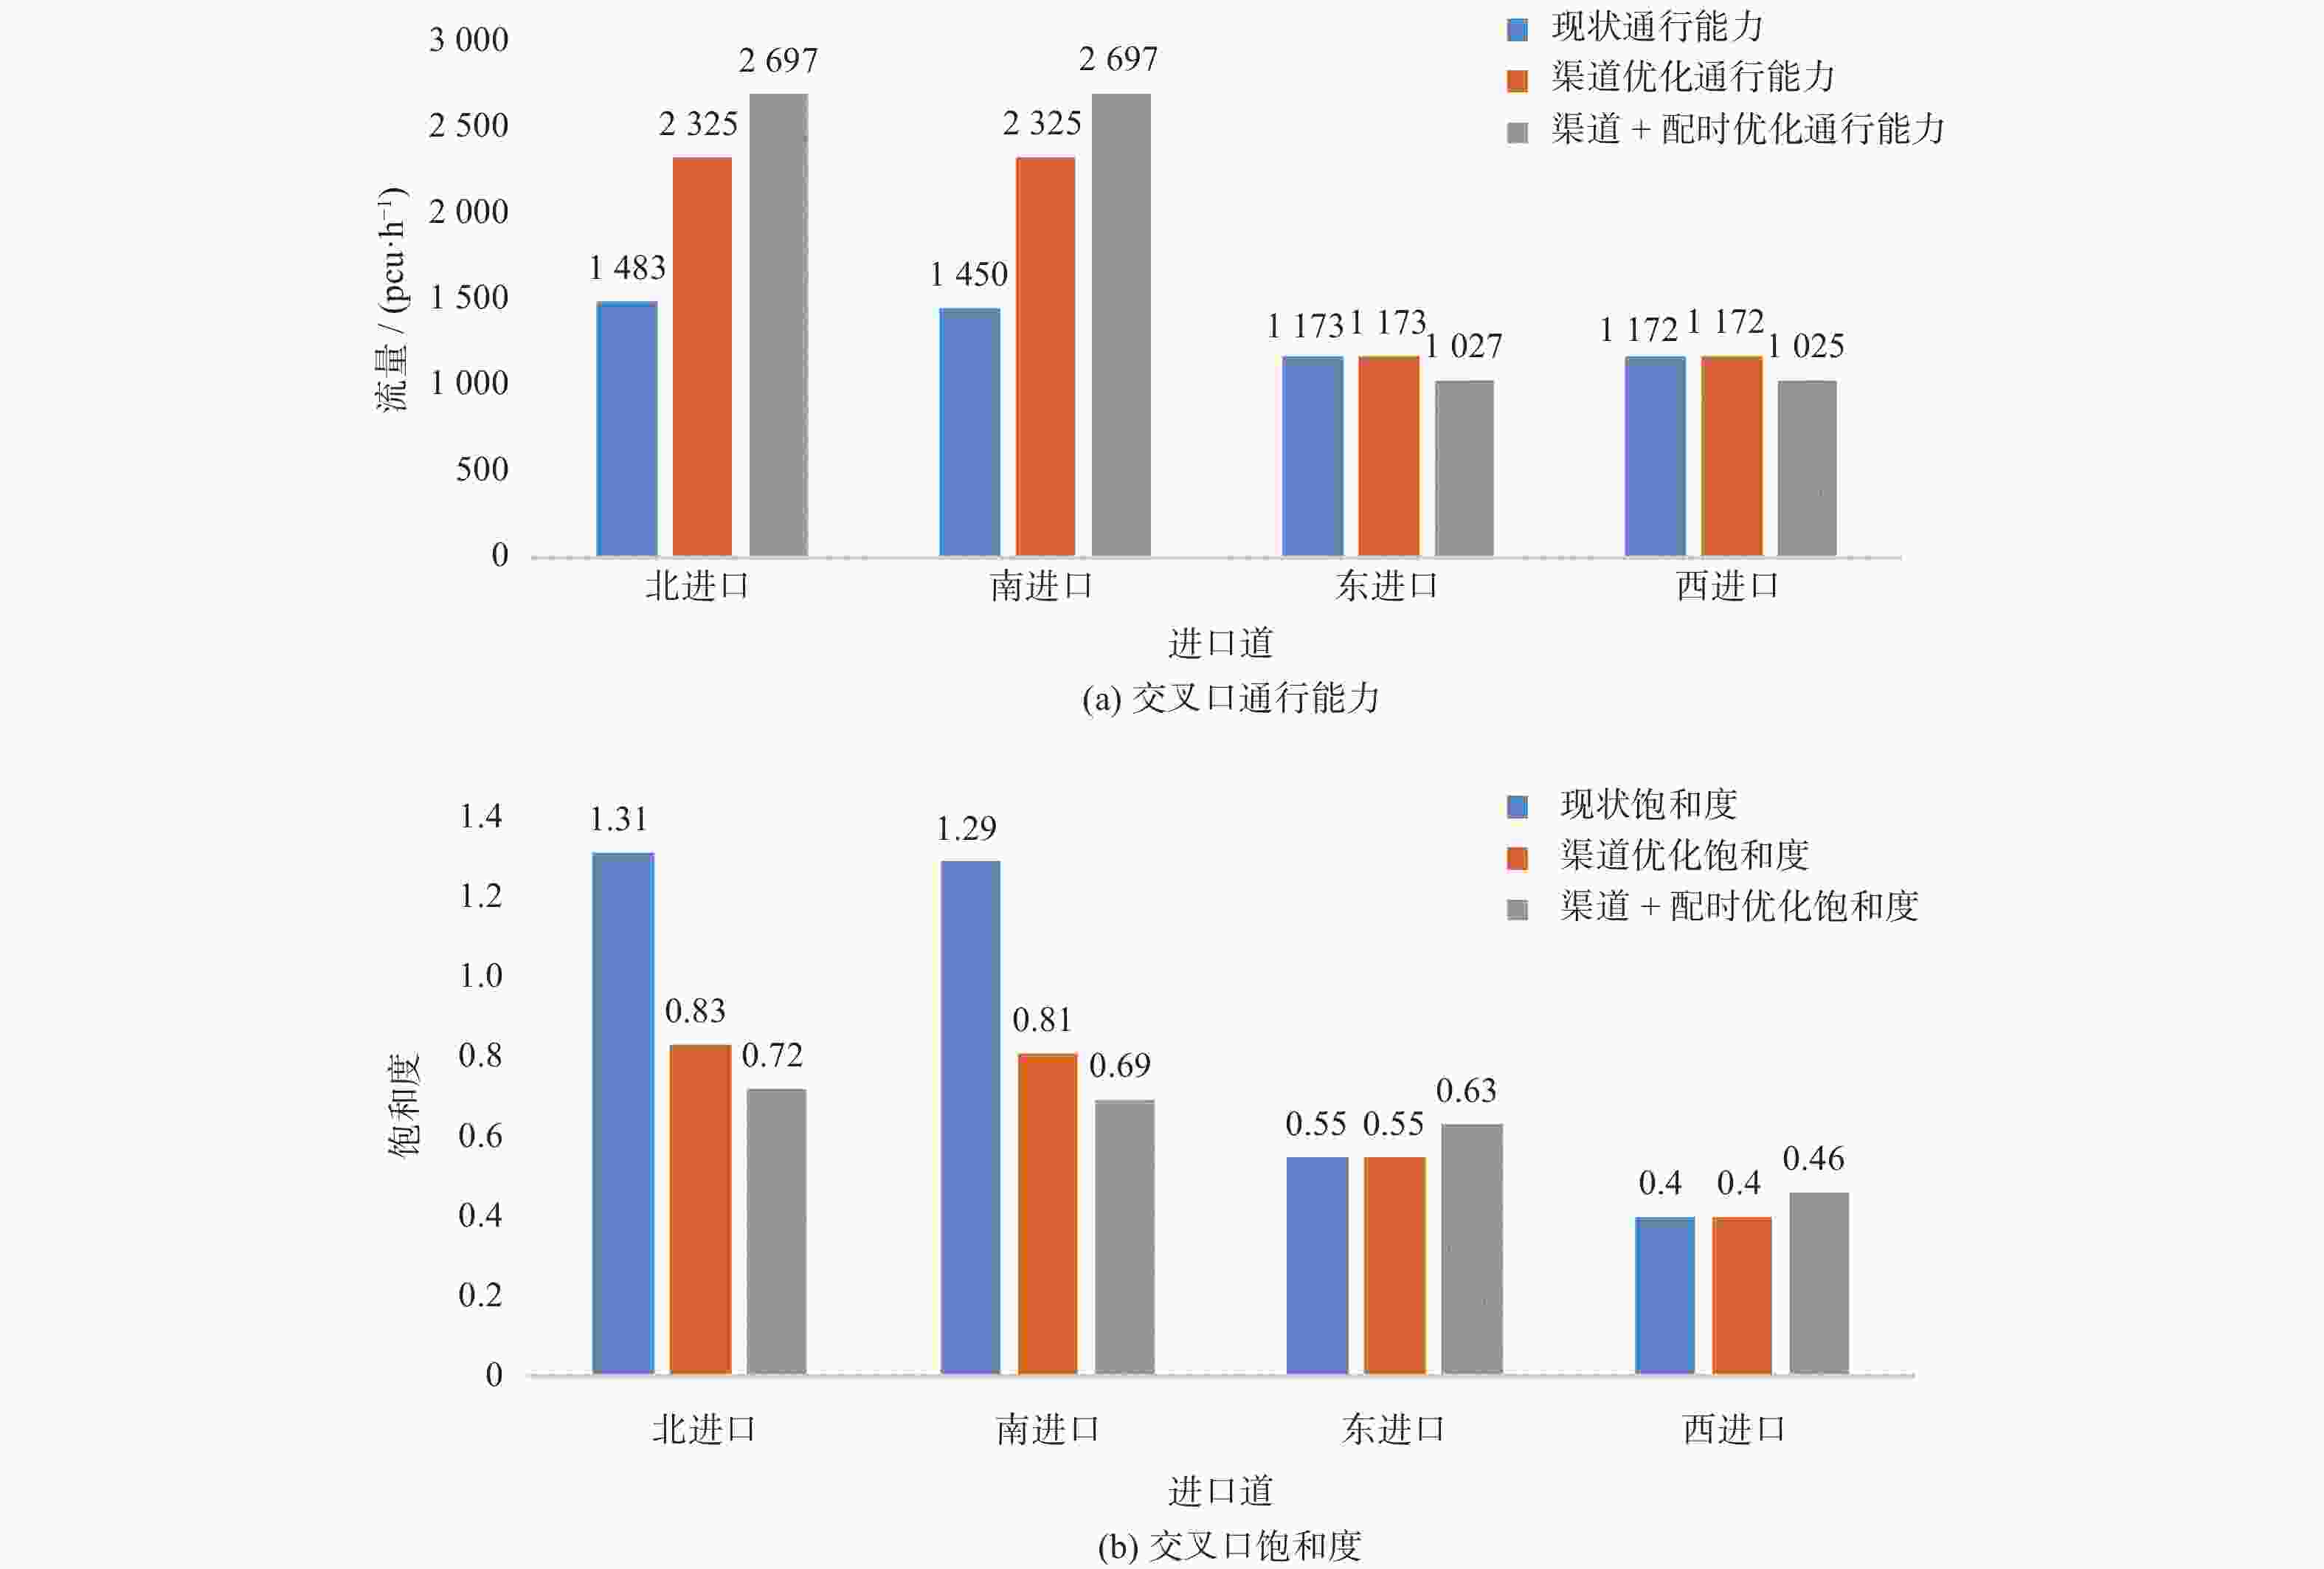
进口道 通行能力/(pcu∙h−1) 饱和度 北进口 1483 1.31 南进口 1450 1.29 东进口 1173 0.55 西进口 1172 0.40 交叉口 4186 1.31 服务水平 四级 表 4 交叉口各进口道流率比
Table 4. Flow rate ratio of each inlet lane at intersection
进口 流向 流率比 总流率比 北进口 左转 0.41 0.81 直行 0.50 右转 0.34 南进口 左转 0.33 直行 0.44 右转 0.44 东进口 直左 0.13 直右 0.31 西进口 直左 0.16 直右 0.16 表 5 交叉口优化前后评价指标对比
Table 5. Comparison of evaluation indicators before and after intersection optimization
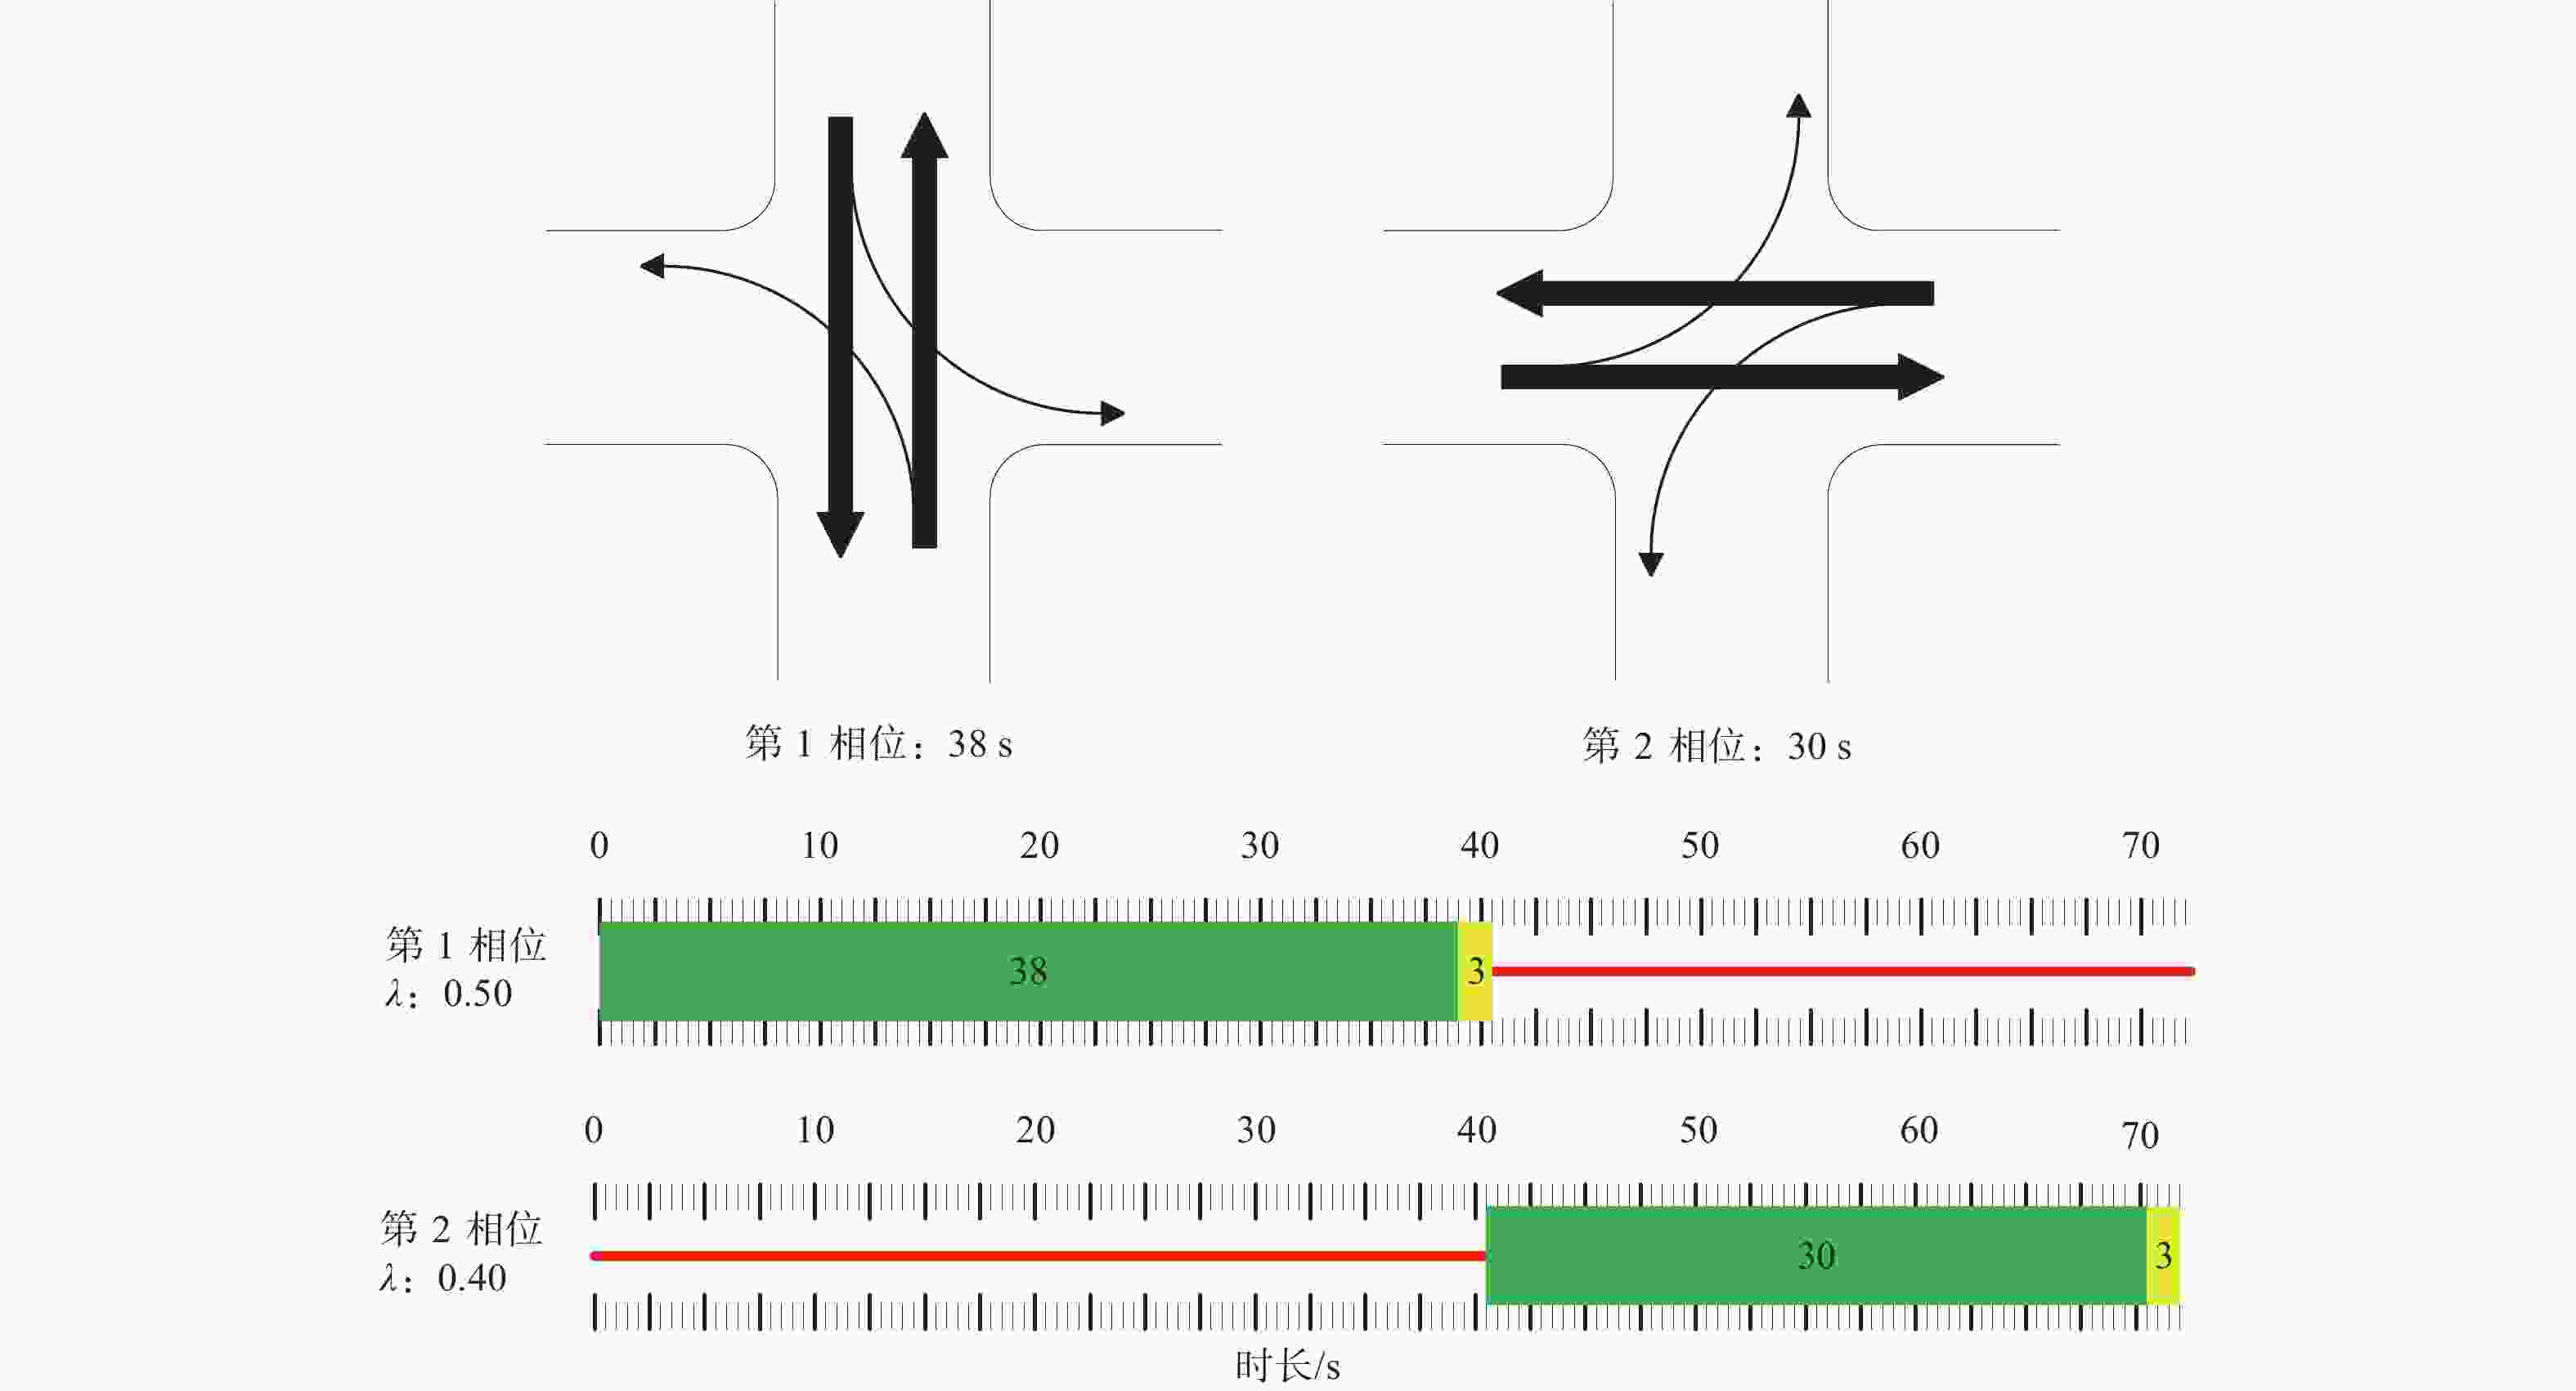
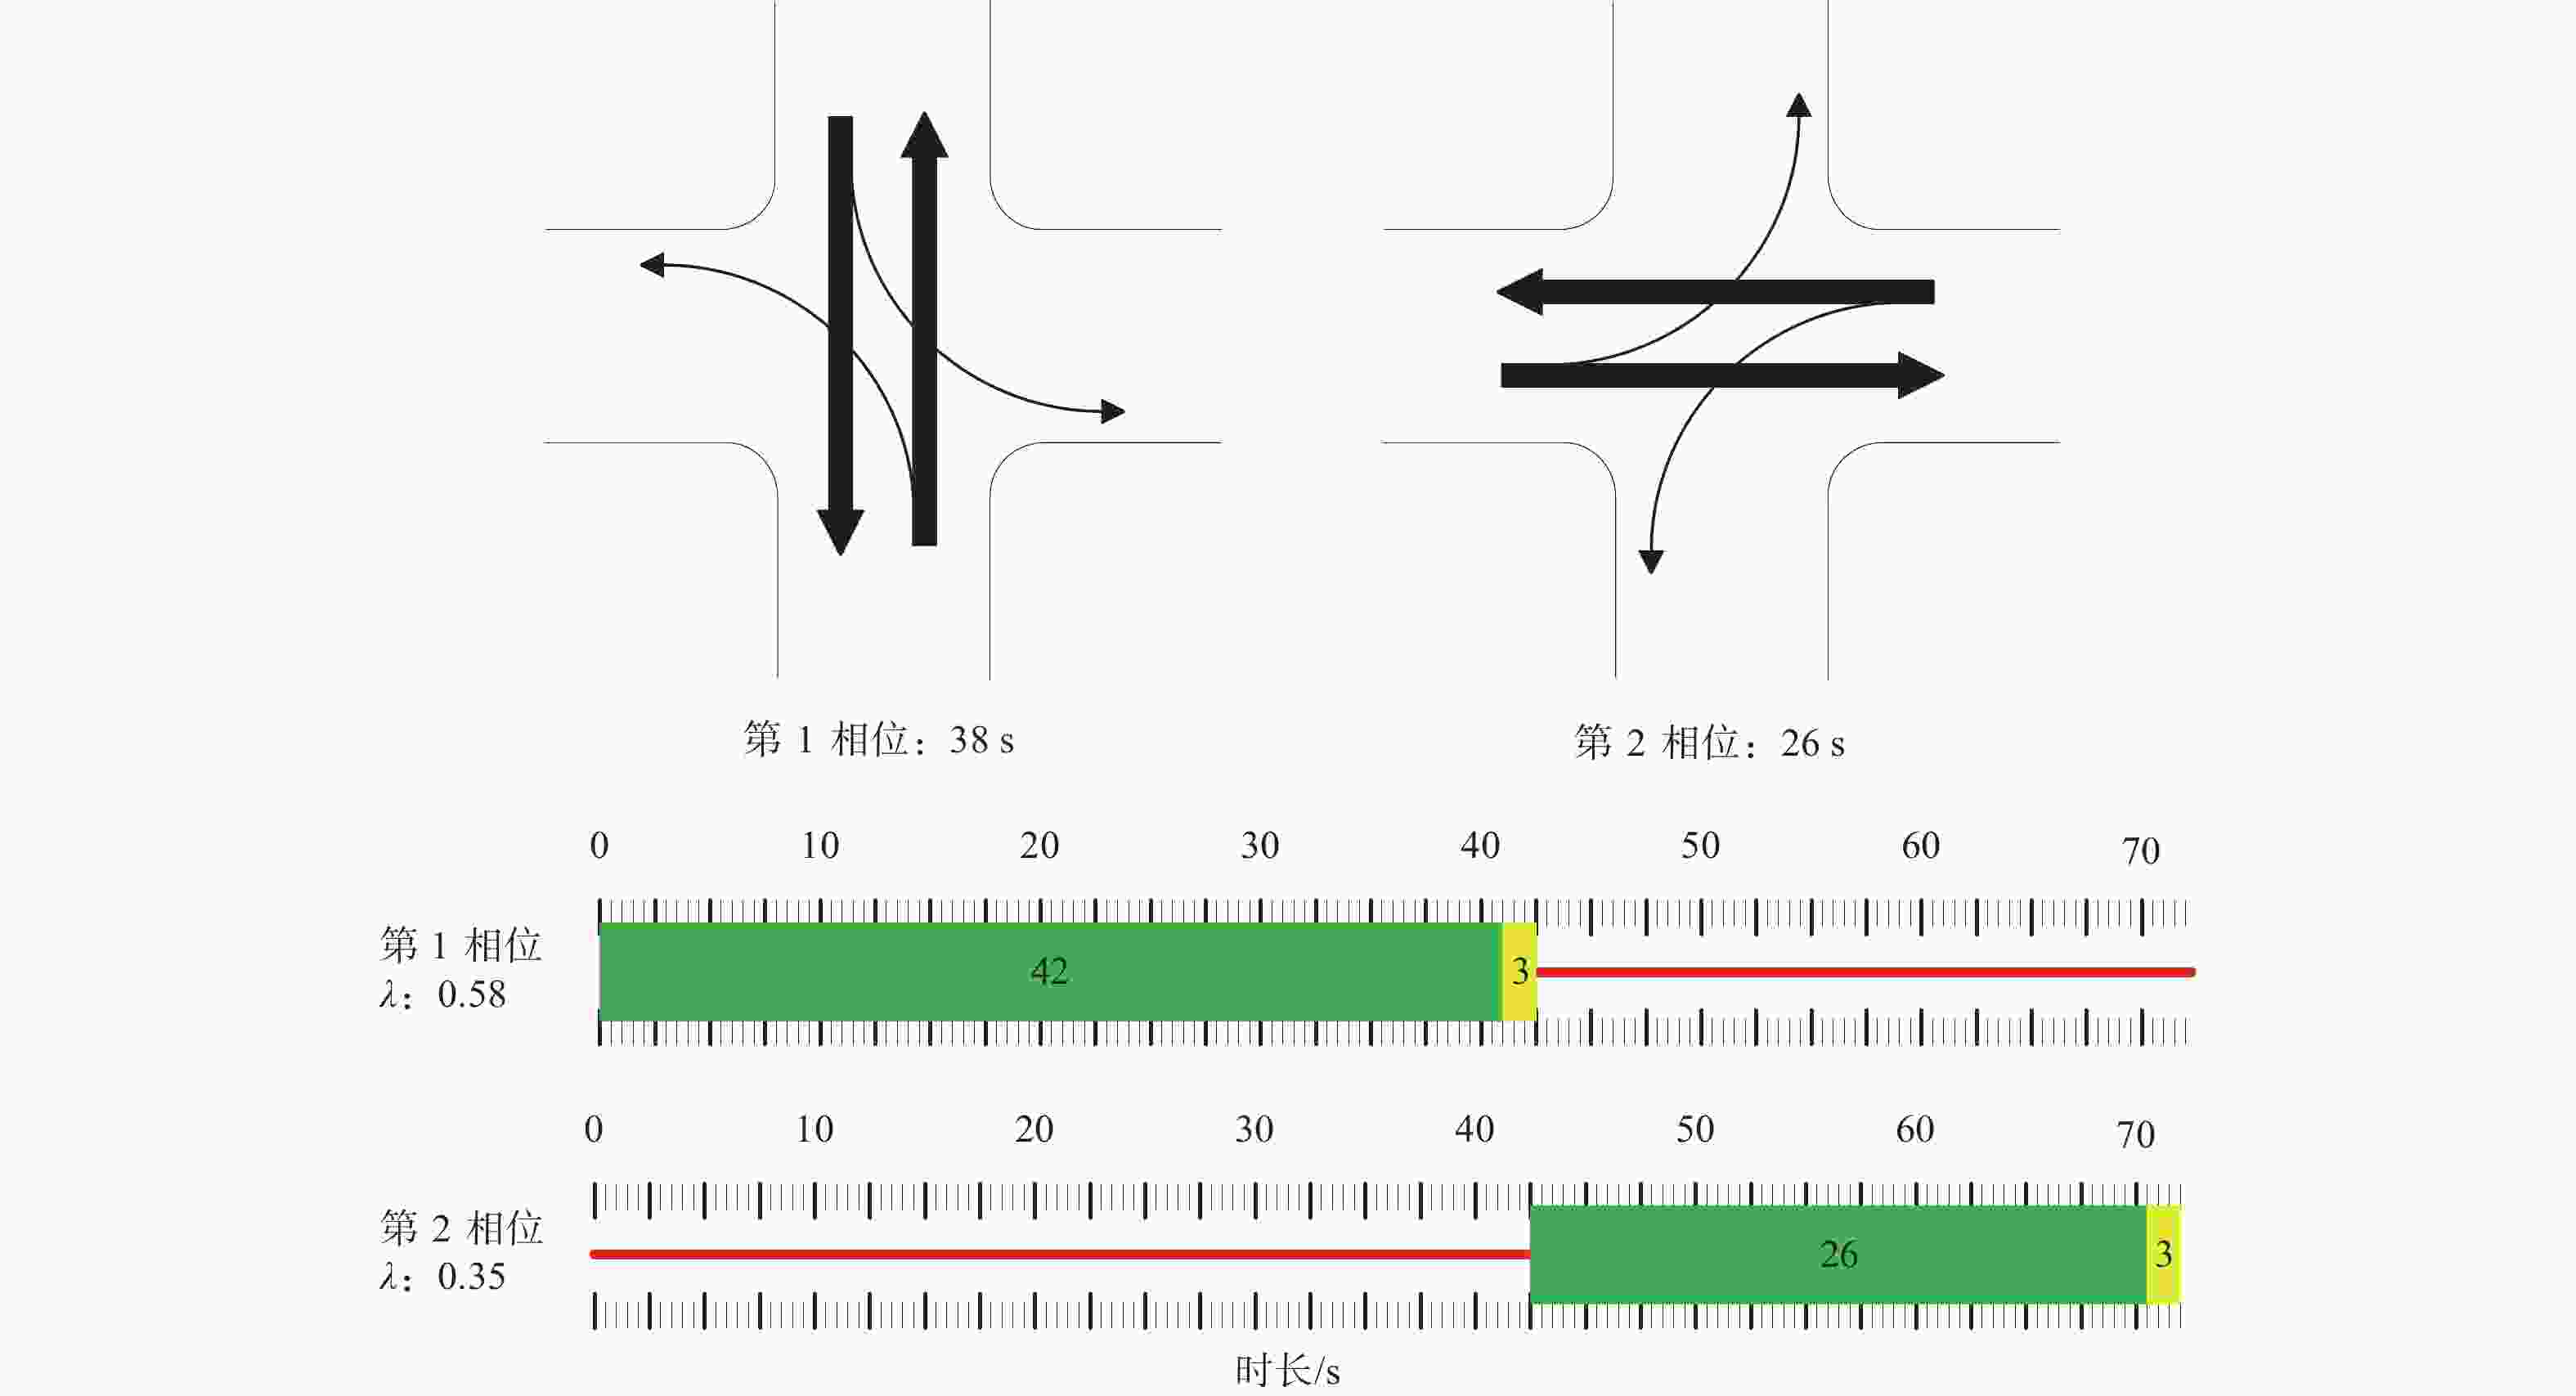
评价指标 现状方案 道路渠化方案 道路+配时优化方案 通行能力/(pcu∙h−1) 4186 6995 7446 饱和度 1.31 0.83 0.72 服务水平 四级 三级 二级 表 6 优化前后仿真参数对比结果表
Table 6. Comparison result table of simulation parameters before and after optimization
评价指标 现状方案 道路优化方案 道路+配时优化方案 排队长度/m 103.33 89.93 68.58 车辆延误/s 69.99 58.00 46.88 服务水平 四级 三级 二级 -
[1] 吴仁良, 杨浩, 刘通. 道路交叉口信号控制效益评价指标及方法[J] . 南京师大学报(自然科学版),2019,42(2):37 − 43. [2] 安实, 宋浪, 王健, 等. 平行流交叉口信号控制策略及效益分析[J] . 交通运输系统工程与信息,2020,20(3):75 − 82. [3] 李劲夫, 胡少帅, 向健. 多路畸形交叉口交通组织渠化设计研究[J] . 公路与汽运,2019(6):30 − 33. doi: 10.3969/j.issn.1671-2668.2019.06.008 [4] 周幸楠, 朱茵. 山地城市X型交叉口渠化设计与研究[J] . 山东交通科技,2017(1):22 − 24. doi: 10.3969/j.issn.1673-8942.2017.01.003 [5] 宋灿灿, 郭忠印, 乔亚丹. 高速公路平曲线标志标线组合设计评价指标[J] . 同济大学学报(自然科学版),2018,46(7):913 − 919,981. [6] 骆荟竹. 城市道路的渠化及交通标志标线的优化研究[J] . 四川建材,2019,45(1):157 − 159. doi: 10.3969/j.issn.1672-4011.2019.01.082 [7] 袁晶矜, 袁振洲. 信号交叉口通行能力计算方法的比较分析[J] . 公路交通技术,2006(5):123 − 128,132. doi: 10.3969/j.issn.1009-6477.2006.05.035 [8] 史国强, 聂化东, 张晓星. 交叉口服务水平评价方法研究[J] . 西部交通科技,2015(6):74 − 76. [9] 张自荷. 基于VISSIM仿真的平面信号交叉口交通组织优化[J] . 山东工业技术,2018(21):143. [10] 杨晓芳, 方琳, 付强. 基于VISSIM仿真的隧道衔接交叉口交通组织优化[J] . 物流科技,2017,40(8):65 − 68. doi: 10.3969/j.issn.1002-3100.2017.08.021 [11] National Research Council. HCM2010: Highway capacity manual[M]. 5th ed.. Washington: Transportation Research Board, 2010. -


 下载:
下载:
