Application of zero-and-one-inflated negative binomial regression model in COVID−19 epidemic analysis
-
摘要:
在公共卫生等应用领域,经常会同时出现零观测值、一观测值较多的情况. 为更好地拟合这类数据,采用0−1膨胀负二项分布及其回归模型进行分析. 在数据扩充基础上,结合Pólya−Gamma潜变量对模型参数进行贝叶斯推断. 最后,对我国湖北省2019冠状病毒病(COVID−19)死亡数据集进行分析. 研究表明,0−1膨胀负二项回归模型能够达到更好的拟合效果.
-
关键词:
- 0−1膨胀负二项回归模型 /
- 2019冠状病毒病 /
- Pólya−Gamma潜变量 /
- 贝叶斯推断
Abstract:Count datas with excess zeros and ones arise frequently in the field of public health. In order to fit the kind of data, a zero-and-one-inflated negative binomial (ZOINB) distribution and its regression model were adopted for analysis. Based on data augmentation strategy and Pólya−Gamma latent variables Bayesian inference was used to estimate the parameters of ZOINB regression model. Finally, one corona virus disease 2019 (COVID−19) death data-set from Hubei Province in China was analyzed. The result illustrates that ZOINB regression model can achieve better fitting effect.
-
表 1 ZOINB回归模型的参数估计
Table 1. Parameter estimation of ZOINB regression model
样本容量 统计量 ${p_1}$ ${\tilde \beta _0}$ ${\beta _1}$ ${\gamma _0}$ ${\gamma _1}$ 50 均值 0.2887 0.8886 1.4325 0.9789 1.9404 中位数 0.2901 0.8881 1.4613 0.9613 1.9567 均方误差 0.0035 0.0031 0.0419 0.0424 0.0504 覆盖率 0.9602 0.9532 0.9421 0.9332 0.9531 100 均值 0.2927 0.8913 1.4915 0.9915 1.9731 中位数 0.2965 0.8948 1.4911 0.9811 1.9273 均方误差 0.0023 0.0013 0.0234 0.0213 0.0193 覆盖率 0.9541 0.9482 0.9492 0.9503 0.9504 表 2 ZOINB回归模型中参数估计均值的比较
Table 2. Comparison of parameter estimation mean in ZOINB regression model
参数 $r = 2$ $r = 3$ $r = 4$ $r = 5$ ${\tilde \beta _0}$ 0.6166 0.6153 0.6144 0.6138 ${\beta _1}$ −0.4722 −0.4536 −0.4434 −0.4766 ${\beta _2}$ 0.3465 0.3458 0.3501 0.3511 ${\beta _3}$ 0.2301 0.2315 0.2334 0.2337 ${\beta _4}$ −1.2605 −1.2825 −1.3332 −1.3536 ${\gamma _0}$ 0.0652 0.0744 0.0758 0.0697 ${\gamma _1}$ 0.1457 0.4187 0.5028 0.5584 ${\gamma _2}$ 0.3487 0.3663 0.3828 0.4087 AIC 1536.314 1537.843 1526.173 1548.801 表 3 ZOINB回归模型中的观测频数与拟合频数
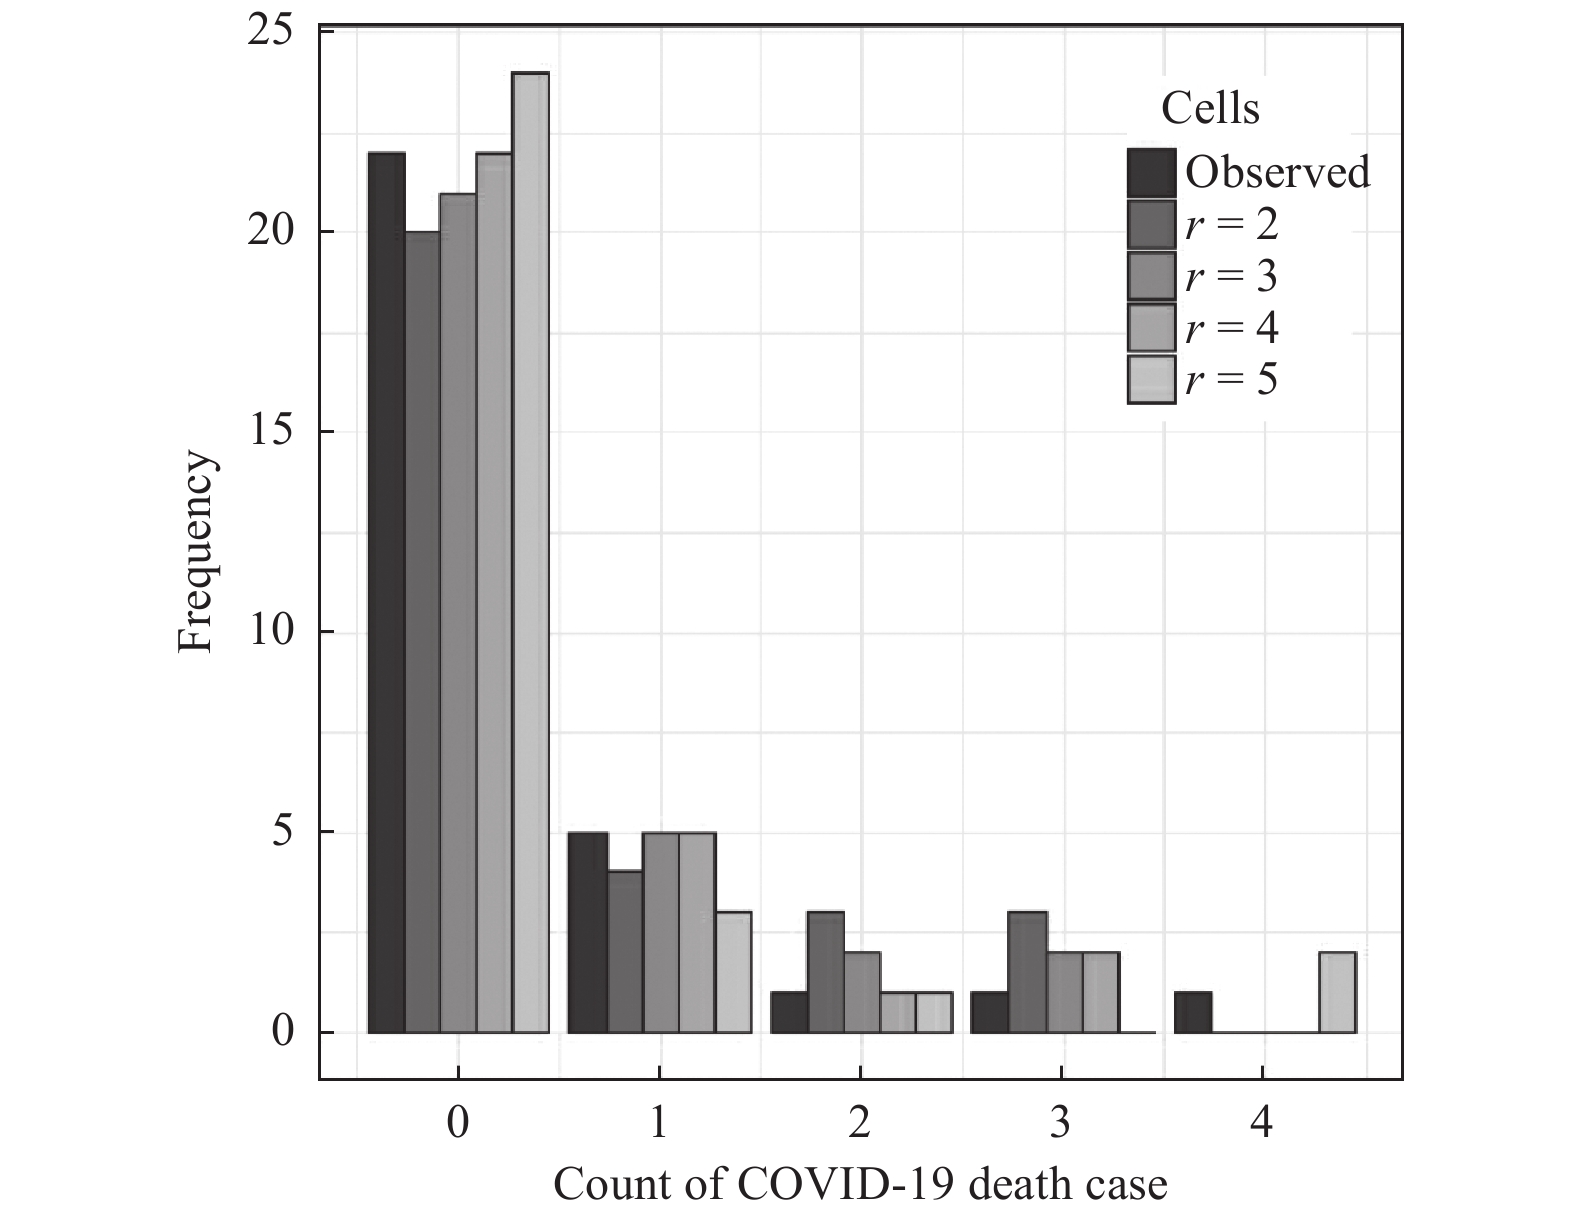
Table 3. Comparison of observation frequency and fitted frequency in ZOINB regression model
观测值 观测频数 拟合频数 $r = 2$ $r = 3$ $r = 4$ $r = 5$ 0 22 20 21 22 24 1 5 4 5 5 3 2 1 3 2 1 1 3 1 3 2 2 0 4 1 0 0 0 2 -
[1] 张良超, 周金亮, 温利民. 零膨胀泊松模型中风险参数的贝叶斯估计[J] . 江西师范大学学报(自然科学版),2020,44(3):269 − 274. [2] 田震. 零一膨胀回归模型及其统计诊断[D]. 昆明: 云南大学, 2016. [3] TANG Y C, LIU W C, XU A C. Statistical inference for zero-and-one-inflated Poisson models[J] . Statistics Theory and Related Fields,2017,1(2):216 − 226. doi: 10.1080/24754269.2017.1400419 [4] LIU W C, TANG Y C, XU A C. A zero-and-one inflated Poisson model and its application[J] . Statistics and Its Interface,2018,11(2):339 − 351. doi: 10.4310/SII.2018.v11.n2.a11 [5] 夏丽丽, 田茂再. 零一膨胀泊松回归模型的非参数统计分析及其应用[J] . 数理统计与管理,2019,38(2):235 − 246. [6] 刘娱, 安博文, 田茂再. 零一膨胀泊松模型的似然检验及模型比较[J] . 统计与决策,2021,37(577):20 − 24. [7] FAROUGHI P, ISMAIL N. Bivariate zero-inflated negative binomial regression model with applications[J] . Journal of Statistical Computation and Simulation,2017,87(3):457 − 477. doi: 10.1080/00949655.2016.1213843 [8] SAFFARI S E, ALLEN J C. Bivariate negative binomial regression model with excess zeros and right censoring: an application to Indonesian data[J] . Journal of Applied Statistics,2020,47(10):1901 − 1914. doi: 10.1080/02664763.2019.1695761 [9] KANG K I, KANG K, KIM C. Risk factors influencing cyberbullying perpetration among middle school students in Korea: Analysis using the zero-inflated negative binomial regression model[J] . International Journal of Environmental Research and Public Health,2021,18(5):2224 − 2224. doi: 10.3390/ijerph18052224 [10] 李蒙. 0−1膨胀负二项模型及其统计分析[D]. 上海: 华东师范大学, 2018. [11] 肖翔. 0−1膨胀几何分布回归模型及其应用[J] . 系统科学与数学,2019,39(9):1486 − 1499. doi: 10.12341/jssms13723 [12] XIAO X, TANG Y C, XU A C, et al. Bayesian inference for zero-and-one-inflated geometric distribution regression model using Pólya-Gamma latent variables[J] . Communication in Statistics-Theory and Method,2020,49(15):3730 − 3743. doi: 10.1080/03610926.2019.1709647 [13] NICHOLAS G P, JAMES G S, JESSE W. Bayesian inference for logistic models using Pólya−Gamma latent variables[J] . Journal of the American Statistical Association,2013,108(504):1339 − 1349. doi: 10.1080/01621459.2013.829001 -


 下载:
下载:


