Measurement of coordinated development level of Yangtze River Delta urban agglomeration under background of new urbanization based on SNA
-
摘要:
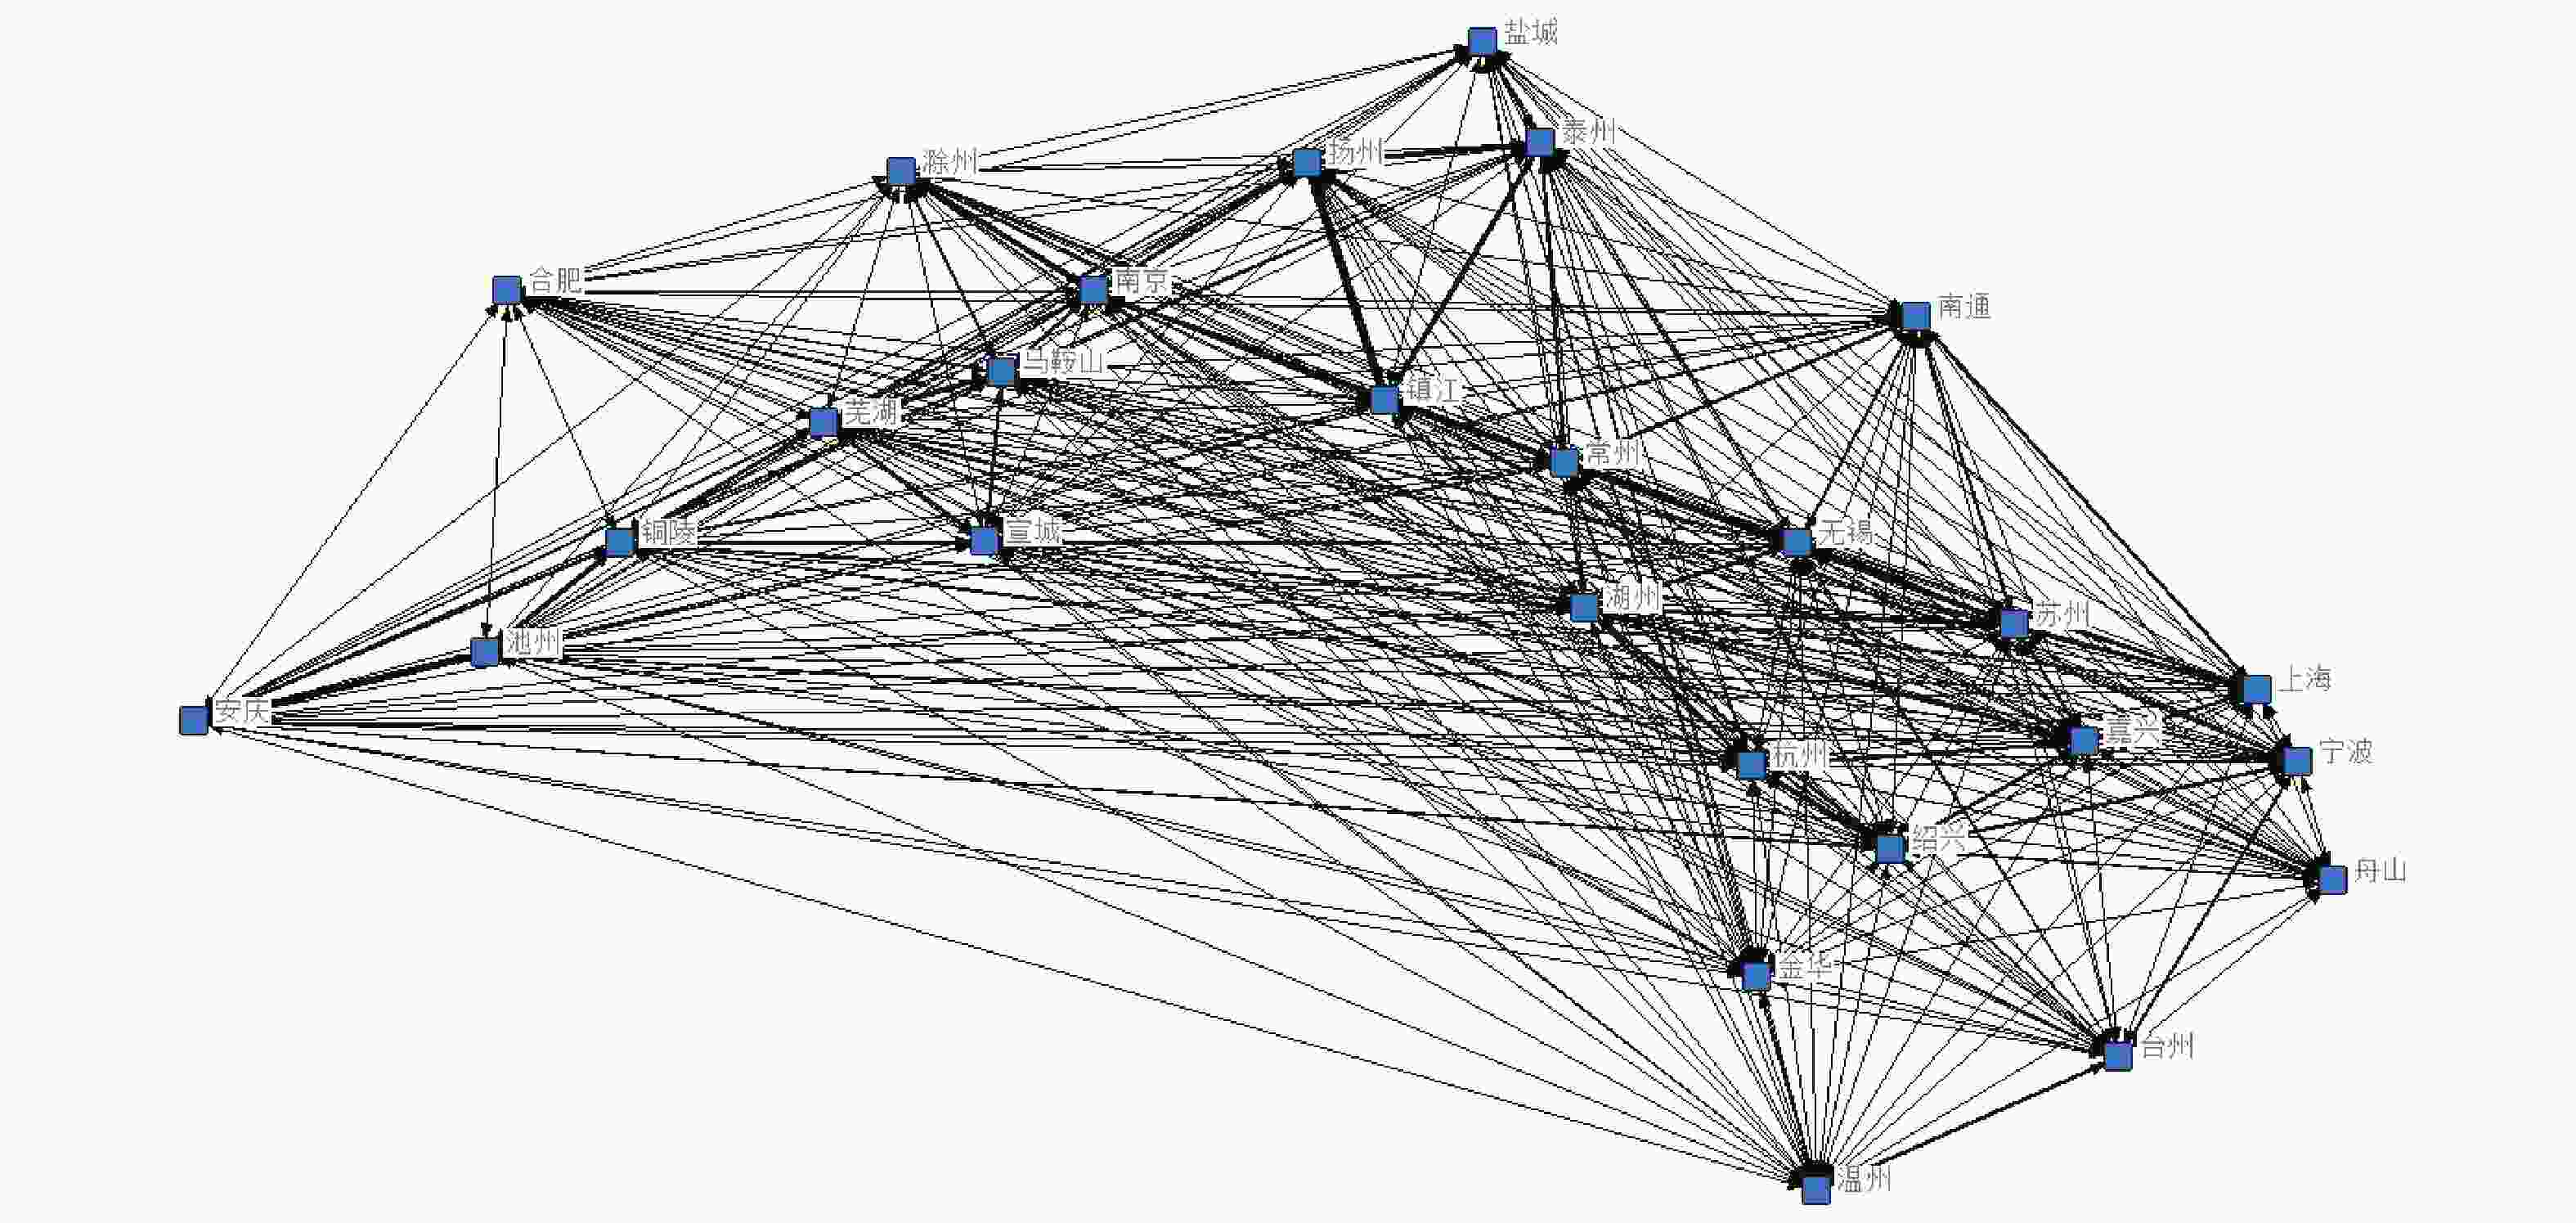
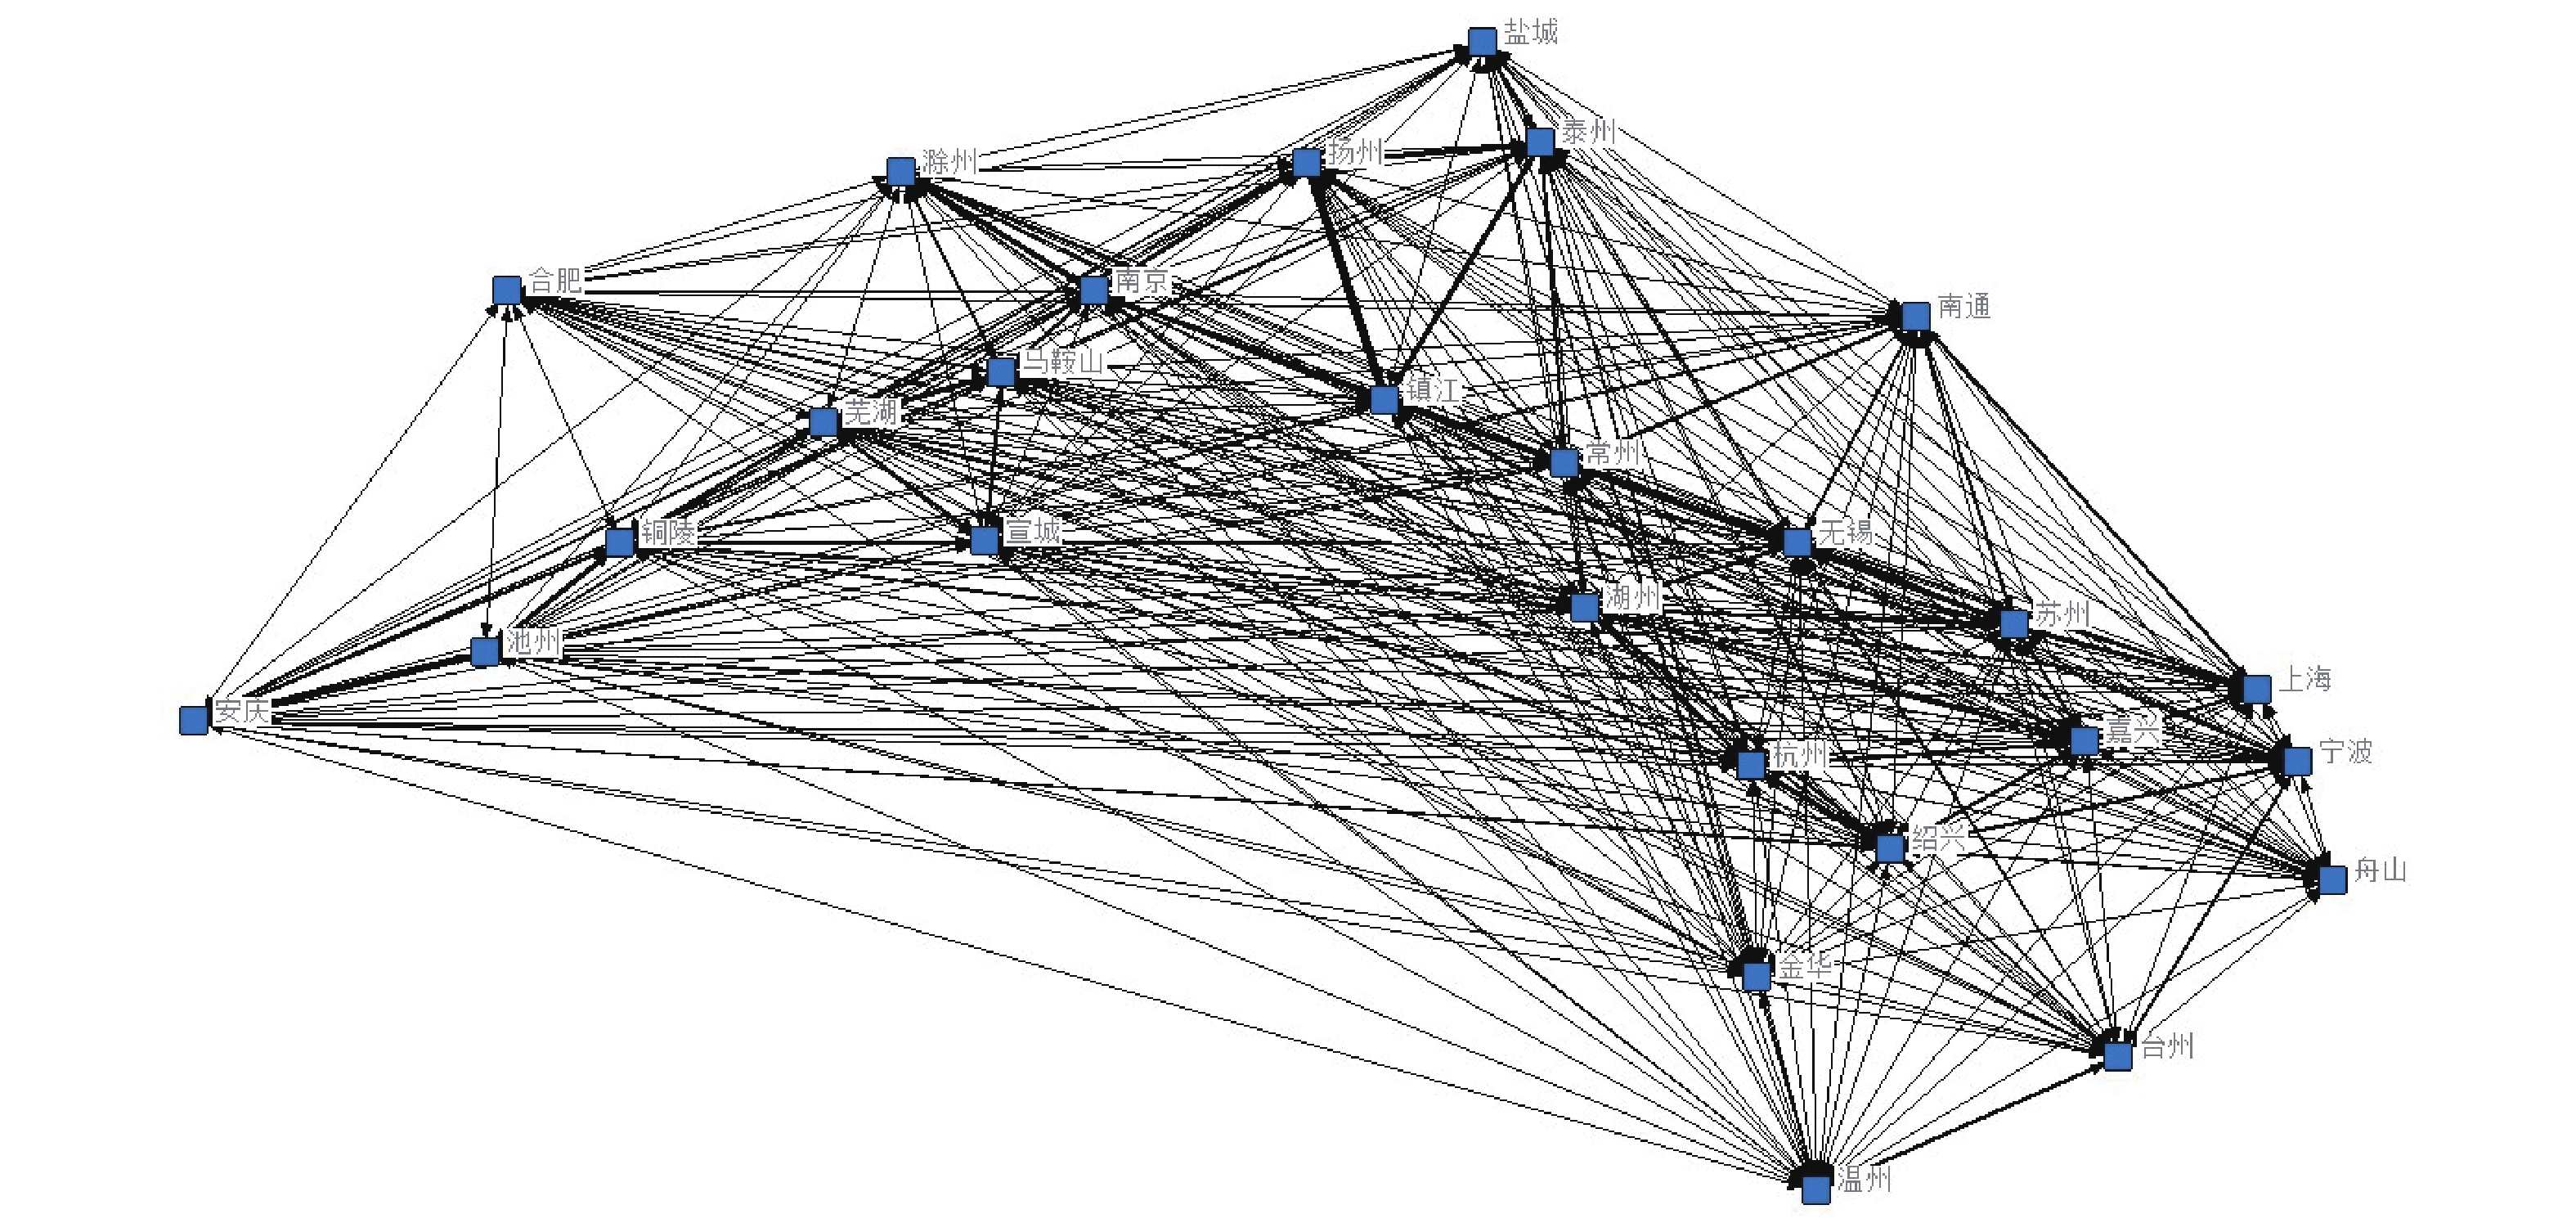
新型城镇化是长三角一体化高质量发展的重要组成部分,考虑新型城镇化水平的影响因素,构建人口−经济−生态−地理的改进引力模型,运用社会网络分析(Social Network Analysis, SNA)方法从网络密度、中心度、核心与边缘、凝聚子群以及高铁因素等方面探讨长三角城市群空间协调发展水平. 结果表明:1)长三角城市群新型城镇化空间关联网络,网络密度较低,上海和苏州的节点中心度最高,上海、杭州等8城市出入度的差值为正值,其城镇化发展对长三角其他城市有明显的空间溢出效应;2)以上海为核心城市,南京、苏州等为重要中介城市,总体呈现由内到外的圈层结构,发展联系度由核心向边缘城市圈层递减,上海、苏州、杭州等8个城市为核心子群,形成“全国经济中心+重要节点城市+强关联省会”城市组合;3)高铁因素对长三角城市群新型城镇化空间关联性影响显著,高铁通达性可促进城镇化区域协调发展. 基于分析,提出核心城市发挥辐射带动作用促进边缘城市发展,突破区域行政划分,完善都市圈布局,从人口、经济、生态等方面协调并进提升新型城镇化水平;优化提高长三角高铁网络密度,通过资源流通促进长三角新型城镇化一体化发展的结论建议.
Abstract:New urbanization is an important part of the integrated and high-quality development of the Yangtze River Delta. Considering the factors affecting the level of new urbanization, an improved gravity model of population-economy-ecology-geography and social network analysis (SNA) method was used to explore the spatial coordinated development level of the Yangtze River Delta urban agglomeration from aspects of network density, centrality, core and periphery, cohesive subgroups and factors of high-speed rail. The results show that: 1) The spatial correlation network of new urbanization in the Yangtze River Delta urban agglomeration is relatively low, and Shanghai and Suzhou have the highest degree of nodal centrality. The difference of the ingress and egress of 8 cities including Shanghai and Hangzhou is positive, and its urbanization development has obvious spatial spillover effects on other cities in the Yangtze River Delta. 2) With Shanghai as the core city, Nanjing and Suzhou as important intermediary cities, the overall structure is from the inside to the outside and the degree of development connection decreases from the core to the peripheral city circle. 8 cities including Shanghai, Suzhou, Hangzhou as the core subgroup, it forms a city combination of "National Economic Center + Important Node Cities + Strongly Associated Provincial Capitals". 3) The high-speed rail factor has a significant impact on the spatial relevance of the new urbanization in the Yangtze River Delta urban agglomeration and the accessibility of the high-speed rail can promote the coordinated development of urbanization regions. Based on the analysis, it is proposed that core cities should play a radiating driving role to promote the development of peripheral cities, break through regional administrative divisions, improve the layout of the metropolitan area, coordinate and improve the level of new urbanization from the aspects of population, economy, ecology and other aspects. To optimize and increase the density of the high-speed rail network in the Yangtze River Delta and promote the integrated development of new urbanization in the Yangtze River Delta through resource circulation. -
表 1 新型城镇化发展水平的影响因素体系
Table 1. Influencing factor system of development level of new urbanization
准则层 指标层 指标性质 编号 人口因素 城镇化率/% 正向 Z1 人口密度/(人·m−2) 正向 Z2 常住人口/万人 正向 Z3 经济因素 人均GDP/元 正向 Z4 城镇居民人均可支配收入/农民人均纯收入 正向 Z5 R&D经费支出占GDP比重 正向 Z6 生态因素 空气质量优良率/% 正向 Z7 森林覆盖率/% 正向 Z8 地理因素 途径城市高铁线路运行班次数 正向 Z9 经纬度地理距离 负向 Z10 表 2 核心−边缘位置内部关系
Table 2. Core-edge location internal relationship
位置内部关系比例 位置分析 $ > ({g_{k - 1}})(g - 1)$ $ < ({g_{k - 1}})(g - 1)$ $ > ({g_{k - 1}})(g - 1)$ 双向溢出板块 净溢出 $ < ({g_{k - 1}})(g - 1)$ 净溢出 边缘板块 表 3 新型城镇化发展水平的人口、经济、生态因素得分
Table 3. Scores of population, economic and ecological factors of development level of new urbanization
城市 人口因素 经济因素 生态因素 城市 人口因素 经济因素 生态因素 上海 0.94 1.50 1.14 湖州 0.88 0.36 1.10 南京 1.00 0.56 1.31 绍兴 0.55 0.38 1.15 无锡 0.66 0.82 1.31 金华 1.11 0.27 1.21 常州 0.62 0.79 1.32 舟山 1.19 0.14 1.43 苏州 0.67 1.05 1.06 台州 1.03 0.30 1.37 南通 0.43 0.59 1.26 合肥 0.54 0.68 1.03 盐城 0.73 0.28 1.24 芜湖 0.76 0.21 1.13 扬州 0.57 0.37 1.38 马鞍山 0.45 0.45 1.14 镇江 0.89 0.19 1.37 铜陵 0.55 0.48 1.15 泰州 0.67 0.46 1.31 安庆 0.62 0.02 1.15 杭州 0.65 0.84 1.14 滁州 0.71 0.09 1.06 宁波 0.60 0.27 1.25 池州 1.16 0.11 1.10 温州 0.54 0.37 1.33 宣城 0.57 0.09 1.28 嘉兴 0.51 0.42 1.11 — — — — 表 4 新型城镇化关联强度矩阵
Table 4. New urbanization correlation strength matrix
城市 安庆 池州 滁州 合肥 马鞍山 铜陵 芜湖 宣城 安庆 0.000 0.014 0.000 0.007 0.000 0.009 0.000 0.001 池州 0.005 0.000 0.000 0.001 0.000 0.008 0.001 0.004 滁州 0.000 0.000 0.000 0.007 0.004 0.000 0.002 0.003 合肥 0.033 0.033 0.051 0.000 0.046 0.057 0.067 0.033 马鞍山 0.000 0.001 0.009 0.005 0.000 0.003 0.026 0.010 铜陵 0.005 0.016 0.000 0.003 0.003 0.000 0.012 0.003 芜湖 0.001 0.003 0.007 0.007 0.063 0.030 0.000 0.029 宣城 0.002 0.001 0.000 0.000 0.004 0.004 0.016 0.000 表 5 空间关联网络节点中心度分析
Table 5. Analysis of node centrality in spatial association network
城市 度 出度 入度 出度−入度 度排名 上海 0.796 0.788 0.435 0.353 1 南京 0.759 0.616 0.460 0.156 2 苏州 0.689 0.644 0.455 0.189 3 杭州 0.616 0.591 0.349 0.242 4 无锡 0.533 0.496 0.392 0.104 5 宁波 0.512 0.425 0.291 0.134 6 常州 0.471 0.380 0.415 −0.035 7 合肥 0.450 0.434 0.249 0.185 8 南通 0.442 0.356 0.351 0.005 9 嘉兴 0.419 0.313 0.385 −0.072 10 湖州 0.406 0.218 0.404 −0.186 11 泰州 0.406 0.256 0.391 −0.135 12 镇江 0.385 0.268 0.373 −0.105 13 绍兴 0.378 0.239 0.346 −0.107 14 扬州 0.350 0.242 0.316 −0.074 15 芜湖 0.287 0.230 0.235 −0.005 16 金华 0.230 0.090 0.216 −0.126 17 马鞍山 0.227 0.160 0.212 −0.052 18 台州 0.191 0.124 0.176 −0.052 19 盐城 0.167 0.079 0.126 −0.047 20 铜陵 0.140 0.075 0.133 −0.058 21 宣城 0.128 0.033 0.126 −0.093 22 温州 0.116 0.087 0.090 −0.003 23 滁州 0.107 0.028 0.107 −0.079 24 池州 0.083 0.017 0.083 −0.066 25 安庆 0.065 0.031 0.052 −0.021 26 舟山 0.055 0.002 0.055 −0.053 27 表 6 空间关联网络核心−边缘分析
Table 6. Core-periphery analysis of spatial correlation network
核心−边缘区 城市(核心度) 密度 核心区域 边缘区域 核心区 上海 常州 南京 南通
苏州 无锡 杭州0.043 0.015 边缘区 安庆 池州 滁州 合肥 马鞍山
铜陵 芜湖 宣城 泰州 盐城
扬州 镇江 湖州 嘉兴 金华
宁波 绍兴 台州 温州 舟山0.008 0.006 表 7 空间关联网络凝聚子群关联度分析
Table 7. Analysis of correlation degree of spatial correlation network cohesion subgroups
城市子群分类 关联度 子群1:上海、苏州、杭州、嘉兴、湖州、无锡、常州、南通 0.042 子群2:南京、镇江、泰州、扬州、盐城 0.039 子群3:宁波、绍兴、金华、台州、温州、舟山 0.020 子群4:合肥、铜陵、滁州、池州、安庆、马鞍山、芜湖、宣城 0.140 -
[1] 中国共产党中央委员会, 国务院. 中共中央、国务院印发《长江三角洲区域一体化发展规划纲要》[N]. 新华日报, 2019-12-02(1). [2] 马奔, 薛阳. 京津冀城市群城镇质量评价研究[J] . 宏观经济研究,2019(4):73 − 83,170. [3] 程如轩, 李澄清. 我国城市化水平及其预期分析[J] . 经济问题探索,2005(1):15 − 18. doi: 10.3969/j.issn.1006-2912.2005.01.004 [4] 张樨樨. 我国城市化水平综合评价指标体系研究[J] . 中国海洋大学学报,2010(1):60 − 64. [5] 陈明星, 陆大道, 张华. 中国城市化水平的综合测度及其动力因子分析[J] . 地理学报,2009, 64(4):387 − 398. doi: 10.3321/j.issn:0375-5444.2009.04.001 [6] 邓韬, 张明斗. 新型城镇化的可持续发展及调控策略研究[J] . 宏观经济研究,2016(2):32 − 47. [7] 赵天如. 都市圈新型城镇化质量测度、识别及提升策略研究: 以苏锡常都市圈与武汉都市圈为例[D]. 武汉: 华中科技大学, 2019. [8] 郭政, 姚士谋, 陈爽, 等. 长三角城市群城市宜居水平时空演化及影响因素[J] . 经济地理,2020,40(2):79 − 88. [9] 叶继红, 项金玉. 长三角城市群新型城镇化质量综合评价研究[J] . 山东行政学院学报,2021(4):73 − 84. doi: 10.3969/J.CNKJ.ISSN.2095-7238.2021.04.009 [10] 冷炳荣, 杨永春, 李英杰. 中国城市经济网络结构空间特征及其复杂性分析[J] . 地理学报,2011(2):199 − 211. doi: 10.11821/xb201102006 [11] 李敬, 陈澍, 万广华, 等. 中国区域经济增长的空间关联及其解释: 基于网络分析方法[J] . 经济研究,2014,49(11):4 − 16. [12] 王方方, 杨焕焕. 粤港澳大湾区城市群空间经济网络结构及其影响因素研究: 基于网络分析法[J]. 华南师范大学学报(社会科学版), 2018(4): 110−120, 191. [13] 安俞静, 刘静玉, 乔墩墩. 城市群城市空间联系网络格局分析: 基于综合交通信息流[J] . 地理科学,2019,39(12):1929 − 1937. [14] 李永奎, 常诚, 郭英, 等. 高铁网络与城市关联的时空演化与相关性分析[J] . 华东经济管理,2019,33(3):5 − 11, 2. [15] 于建峰. 不同交通方式对兰西城市群空间分布影响研究[J] . 铁道运输与经济,2019,41(10):7 − 13,40. [16] 滕堂伟, 欧阳鑫. 长三角高质量一体化发展路径探究: 基于城市经济效率视角[J] . 工业技术经济,2019,38(7):152 − 160. doi: 10.3969/j.issn.1004-910X.2019.07.019 [17] 姚鹏, 王民, 鞠晓颖. 长江三角洲区域一体化评价及高质量发展路径[J] . 宏观经济研究,2020(4):117 − 125. [18] 李博雅. 长三角城市群空间结构演化与溢出效应研究[J] . 宏观经济研究,2020(5):68 − 81. [19] 田宝龙, 刘尚俊. 新疆新型城镇化发展协调度时空变化及动力因素分析[J] . 中国农业资源与区划,2018(5):193 − 199. [20] 李雪涛, 吴清扬. 新型城镇化测度及其协调发展的空间差异分析[J] . 统计与决策,2020(8):67 − 71. [21] 牟玲玲, 尹赛. 基于社会网络分析的京津冀新型城镇化发展水平研究: 以新沂市为例[J] . 现代城市研究,2019(6):95 − 101. -


 下载:
下载:


