Measurement and influencing factors study of spatial quality in urban waterfront areas along the Suzhou River in Shanghai supported by multi-source data
-
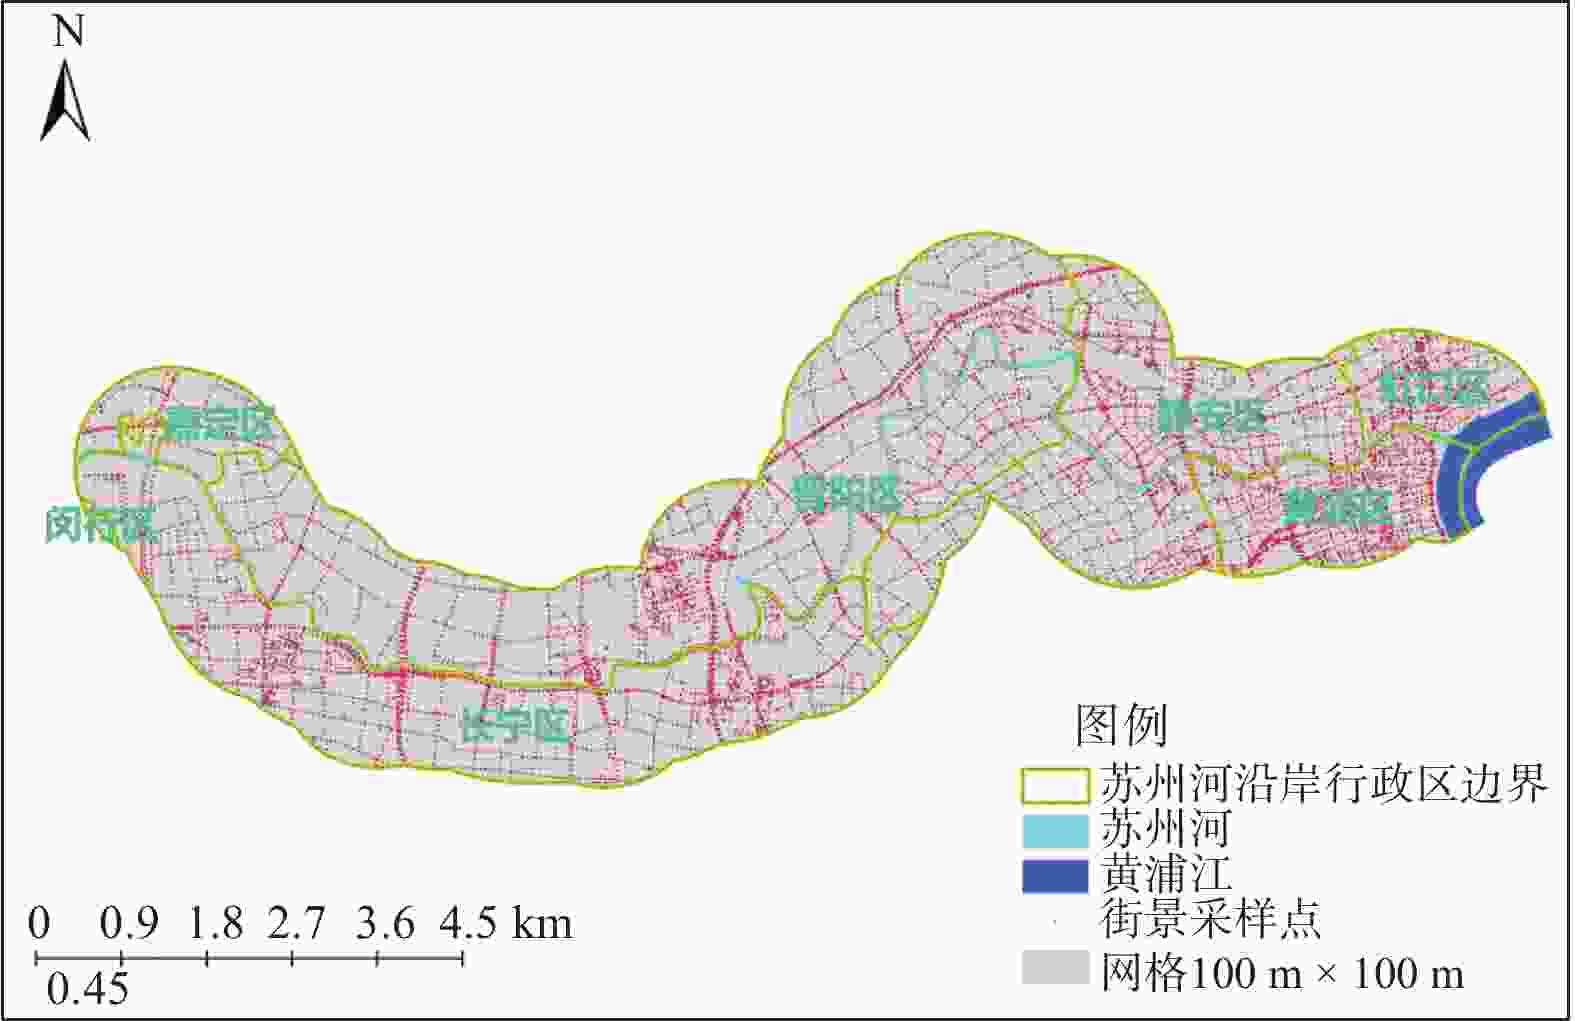
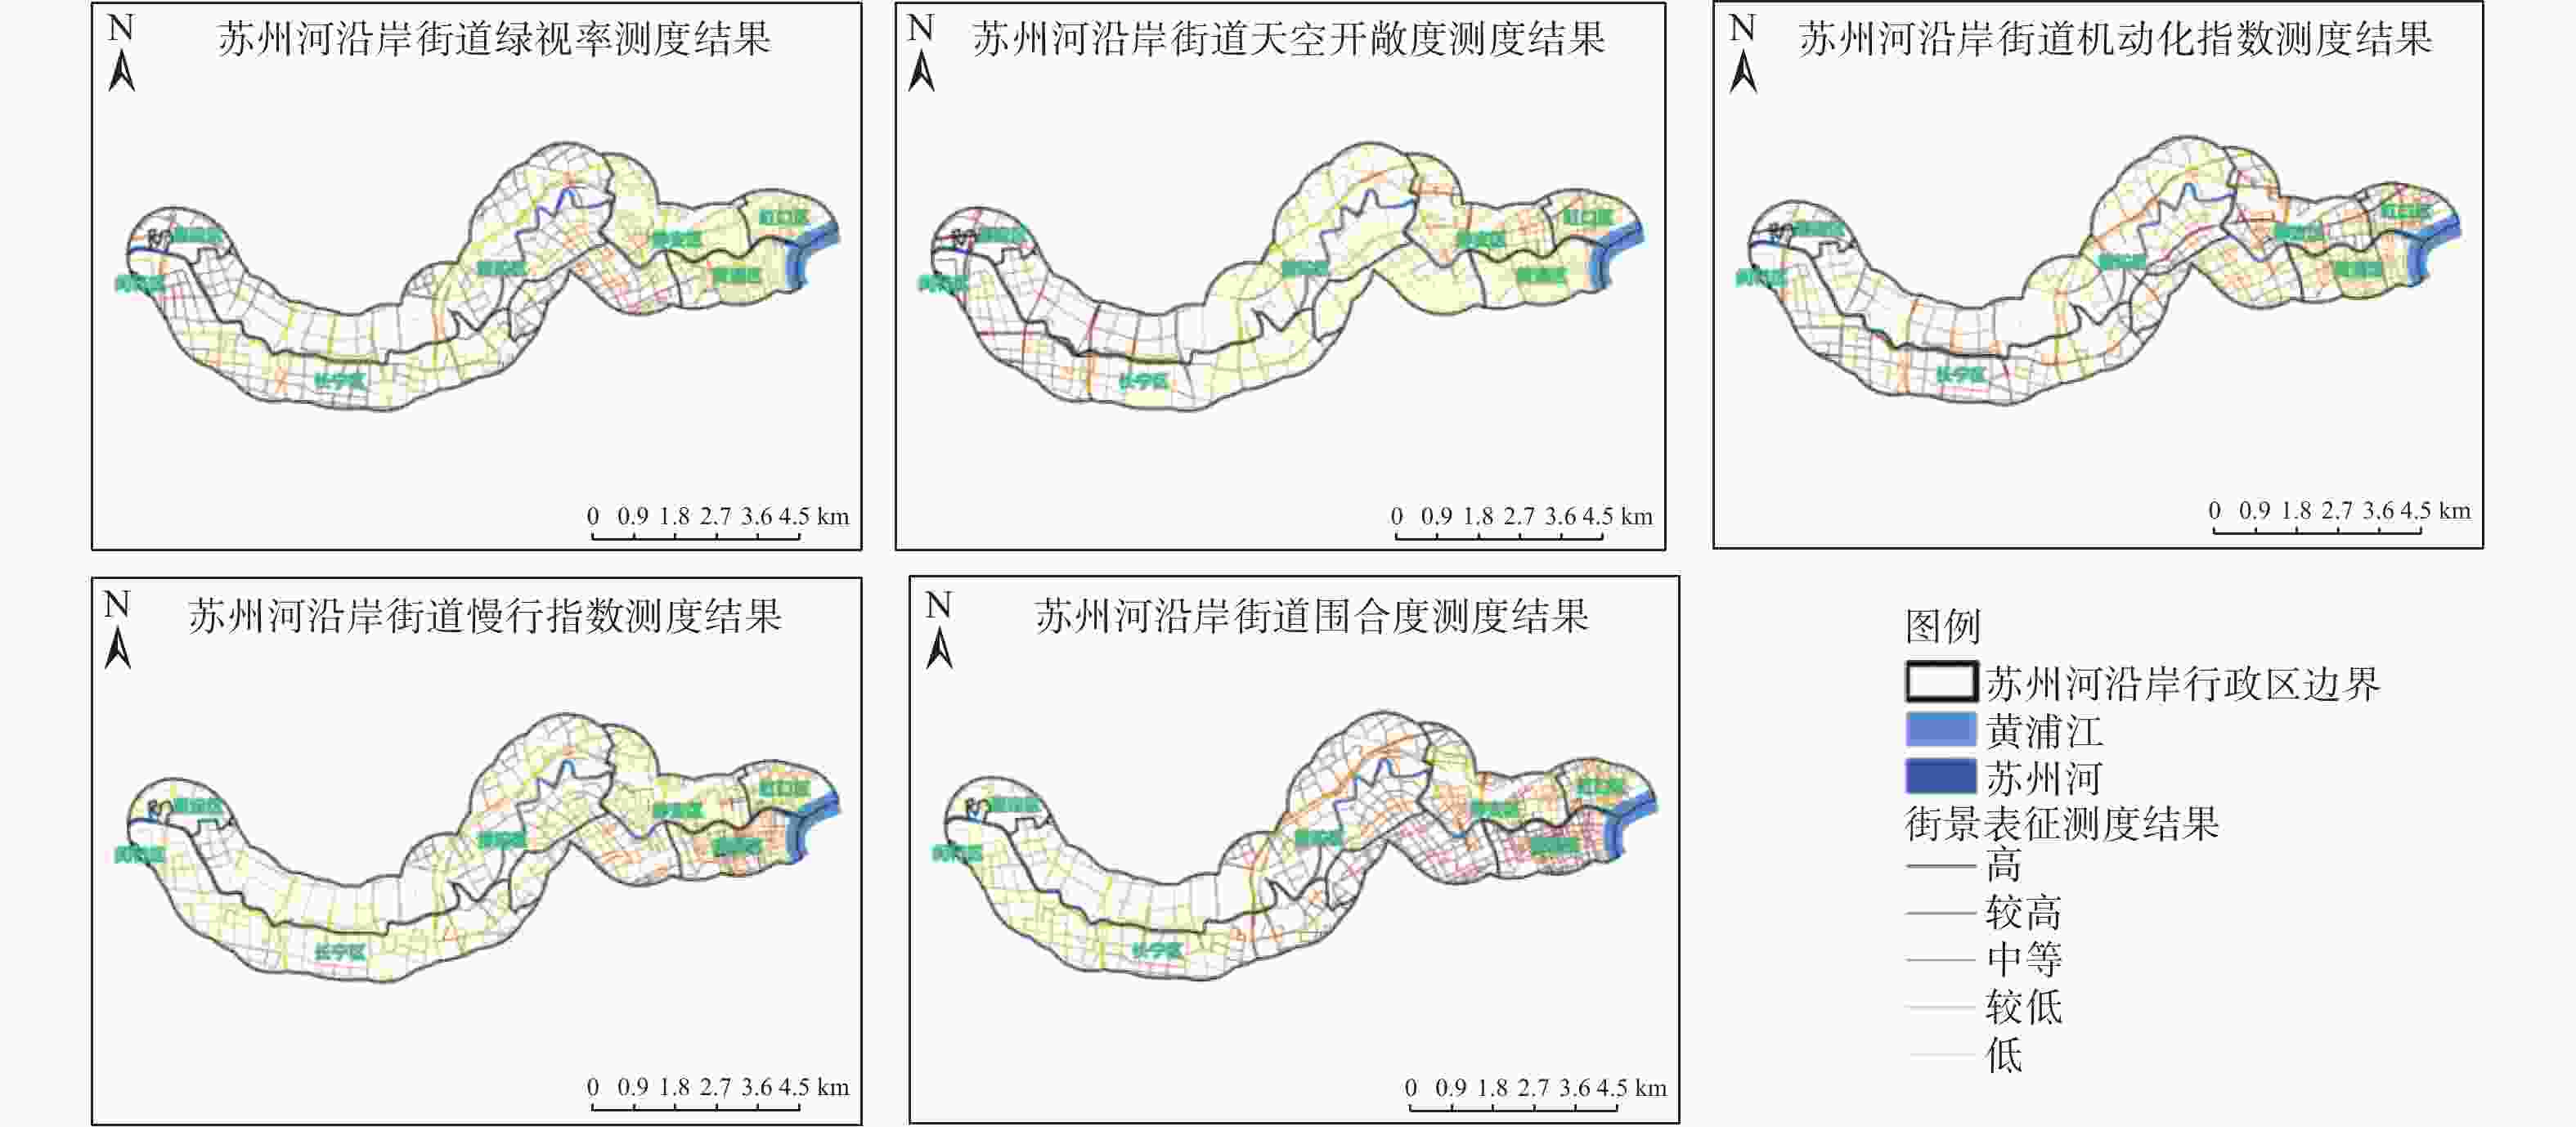
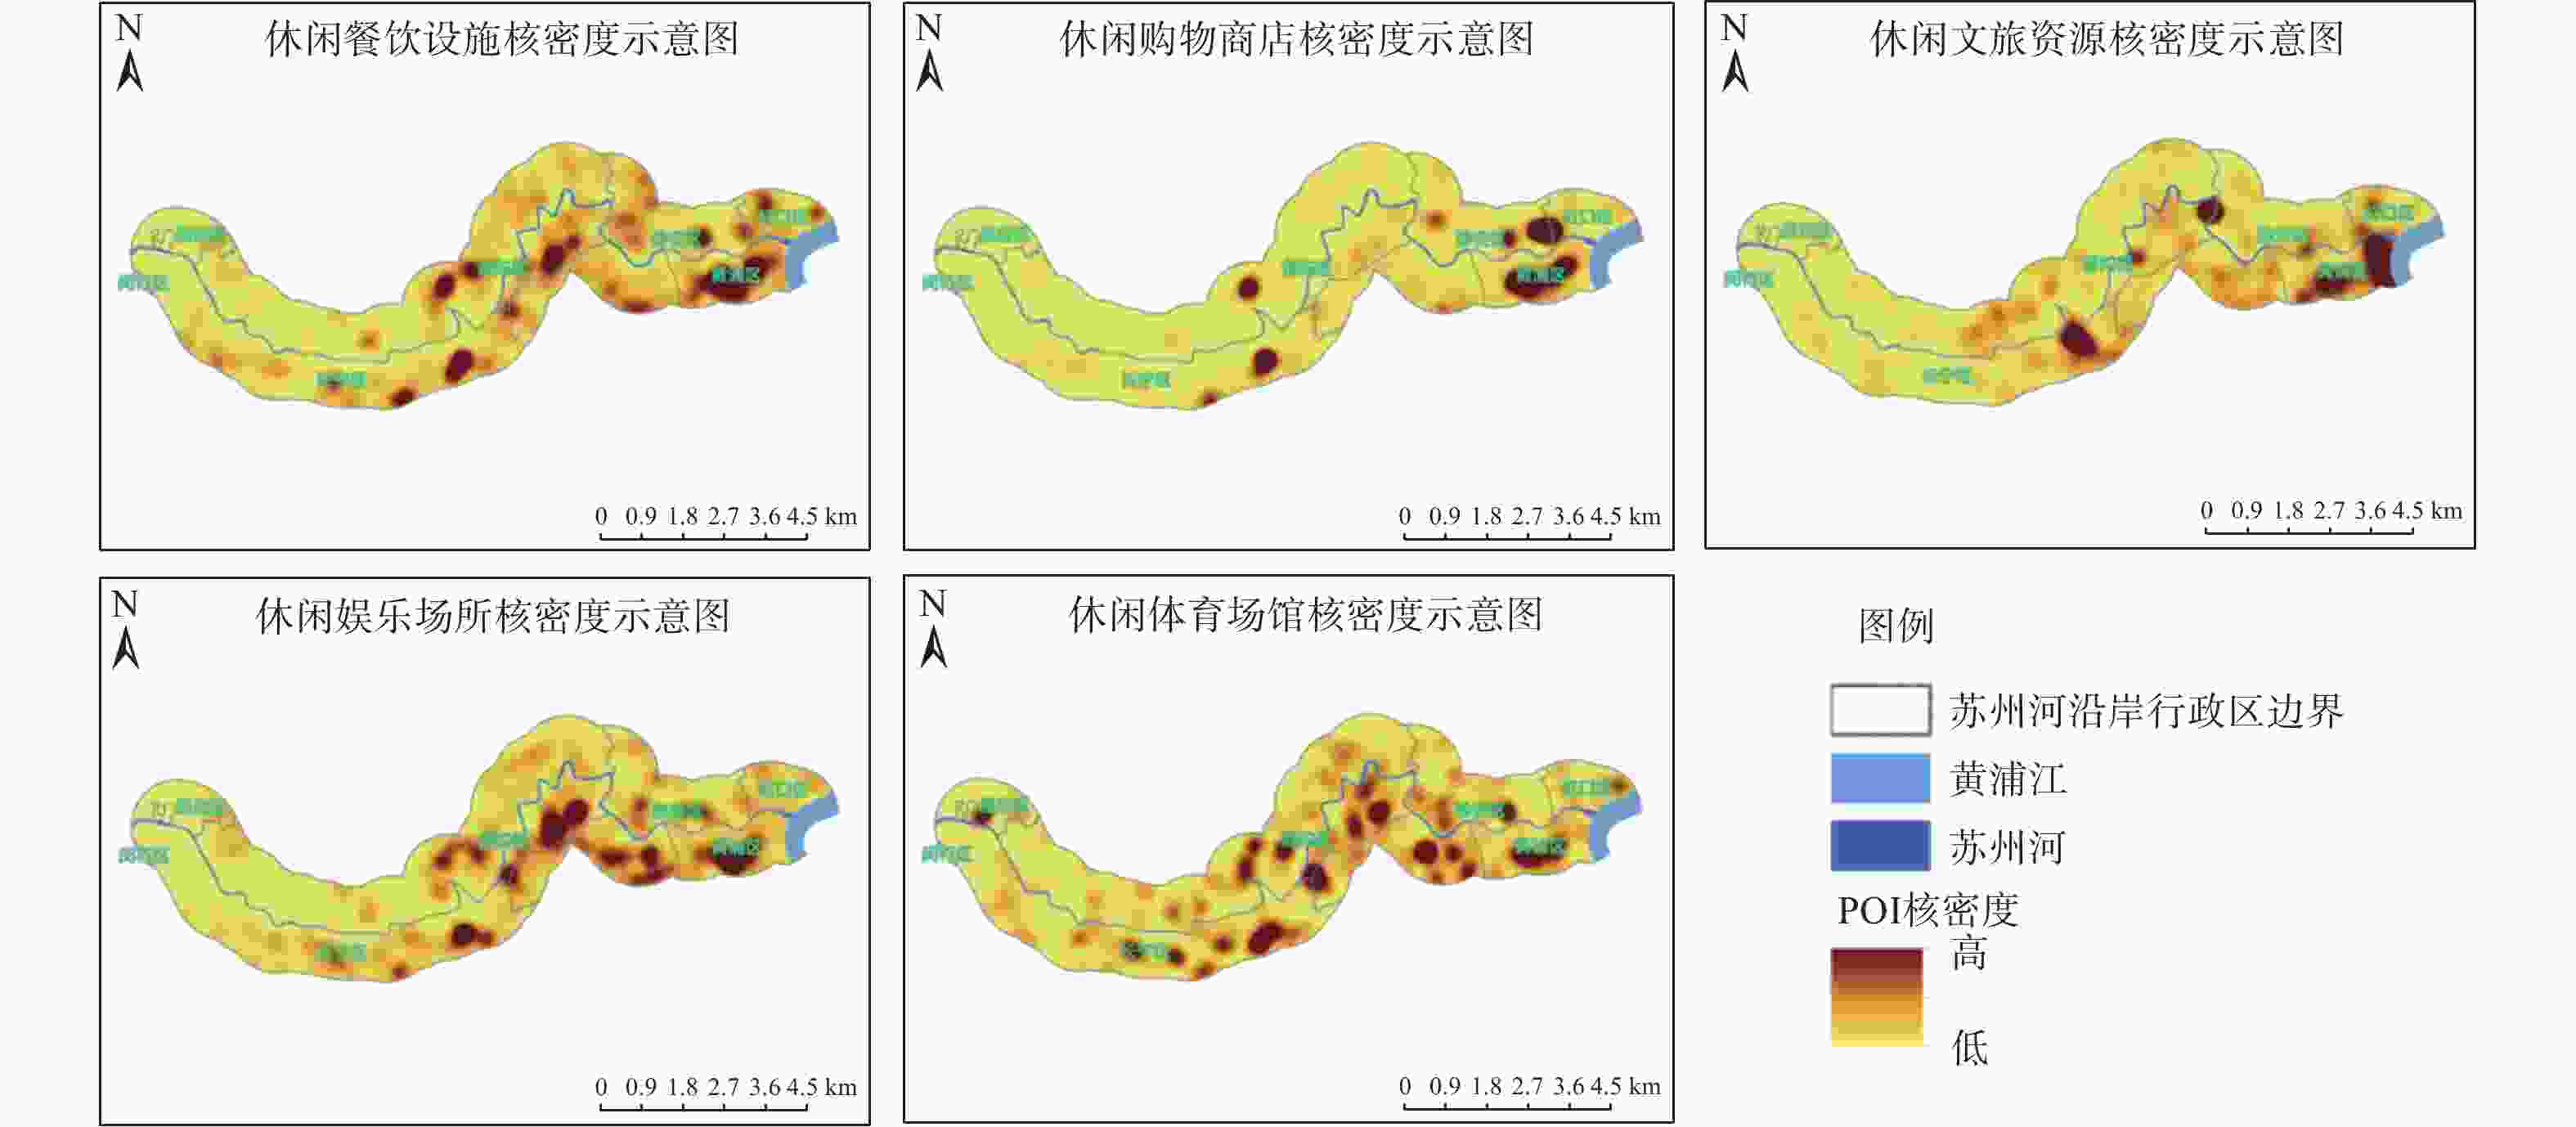
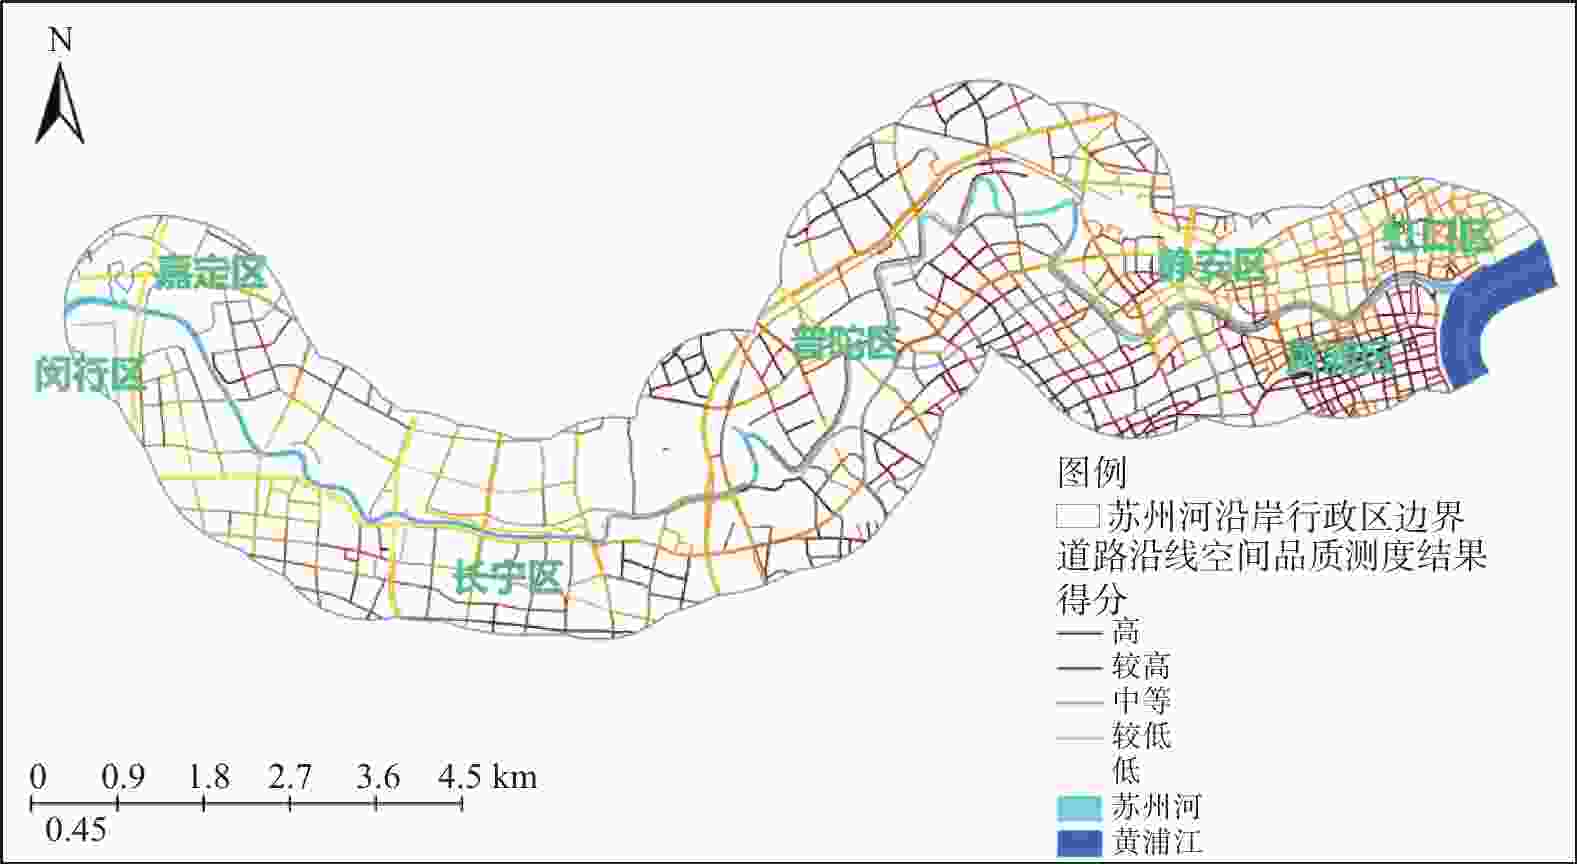
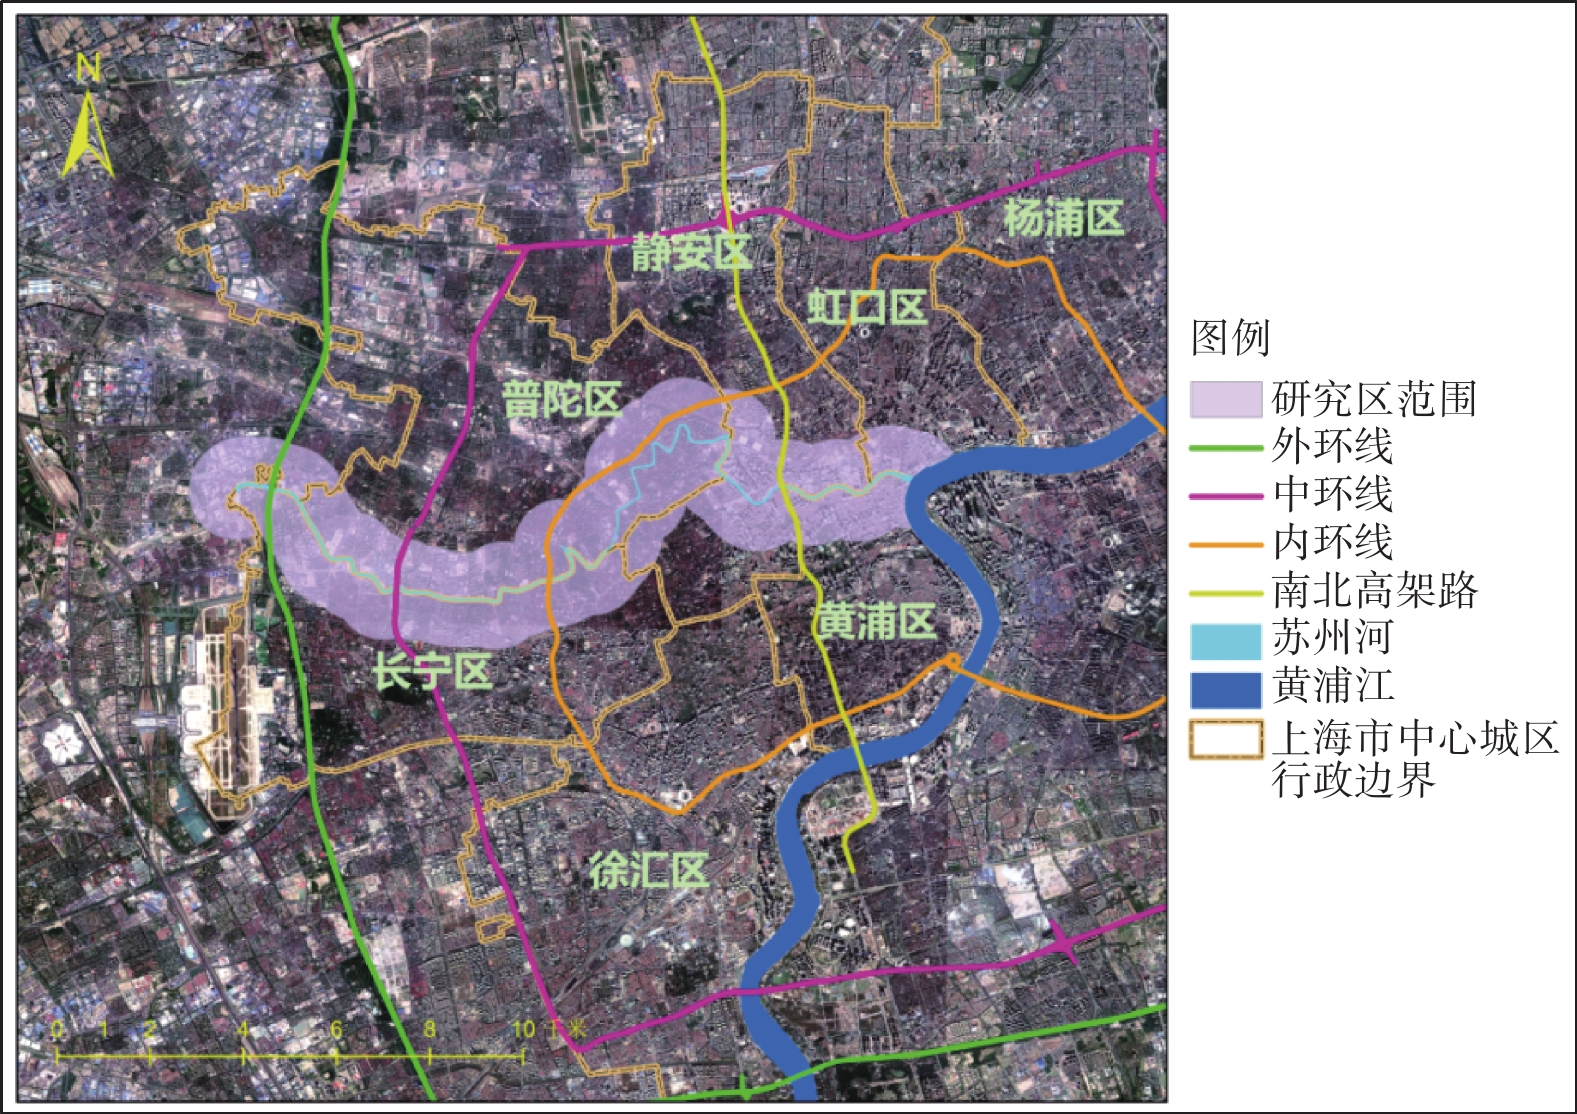
摘要: 城市滨水区的空间品质是城市发展建设水平的重要标志,传统的空间品质研究存在空间尺度较小、主观性较强、研究角度单一等问题。基于Open Street Map路网数据、百度地图街景数据与百度地图POI数据,结合机器学习技术对上海苏州河沿岸地区空间品质进行测度,使用MGWR2.2.1软件建立空间品质影响因素的多尺度地理加权回归模型。结果表明:研究区内普陀区西部、长宁区西部和静安区苏河北岸空间品质较低,应作为未来重点提升的区域;休闲业态在研究区内分布不均衡,空间配置应调整优化;研究区东部适合通过植树、修建步道、开辟步行街等方式提升空间品质,西部应着重发展餐饮、购物、娱乐等休闲消费业态。研究结果可为苏州河沿岸地区空间品质优化提供参考。Abstract:
The spatial quality of urban waterfront areas is an important indicator of the level of urban development and construction. Traditional research on spatial quality has problems such as limited spatial scale, strong subjectivity, and single research perspective. Based on Open Street Map road data, Baidu Map street views, and Baidu Map point-of-interest (POI) data, combing with machine learning technology, the spatial quality of waterfront area along the Suzhou River in Shanghai was measured. MGWR2.2.1 software was used to establish a multi-scale geographically weighted regression model for influencing factors of spatial quality. The result shows that the western Putuo District, western Changning District, and the north bank of Suzhou River in Jingan District have low spatial quality in the study area, which should be prioritized during optimization. The eastern part of the study area is suitable for improving spatial quality through measures such as planting trees, building pedestrian paths, and opening pedestrian streets, while the western part should focus on developing leisure and consumer industries such as catering, shopping, and entertainment, as well as conjunct them with existing park green space resources, more trees should be planted, pocket parks are also necessary. The study results can provide a reference for optimizing the spatial quality of the Suzhou River waterfront area. -
Key words:
- urban waterfront /
- Suzhou River /
- street view /
- multi-source data /
- machine learning
-
表 1 苏州河沿岸各区各类休闲设施数量
Table 1. Numbers of various leisure facilities in various areas along Suzhou River
个 行政区 休闲文旅资源 休闲餐饮设施 休闲购物商店 休闲体育场馆 休闲娱乐场所 休闲相关POI总数 黄浦区 144 1466 2312 98 396 4416 虹口区 43 466 444 33 115 1101 静安区 104 1818 2543 225 778 5468 长宁区 143 1648 1586 197 558 4132 普陀区 181 2280 1507 306 985 5259 总计 615 7678 8392 859 2832 20376 表 2 苏州河沿岸休闲设施空间相关性一览
Table 2. Spatial correlations of various leisure facilities along Suzhou River
休闲设施 休闲餐饮设施 休闲购物商店 休闲文旅资源 休闲娱乐场所 休闲体育场馆 休闲餐饮设施 1 0.537** 0.259** 0.483** 0.339** 休闲购物商店 0.537** 1 0.202** 0.302** 0.205** 休闲文旅资源 0.259** 0.202** 1 0.121** 0.126** 休闲娱乐场所 0.483** 0.302** 0.121** 1 0.455** 休闲体育场馆 0.339** 0.205** 0.126** 0.455** 1 表 3 研究区内空间感知得分
Table 3. Spatial Cognition score in study area
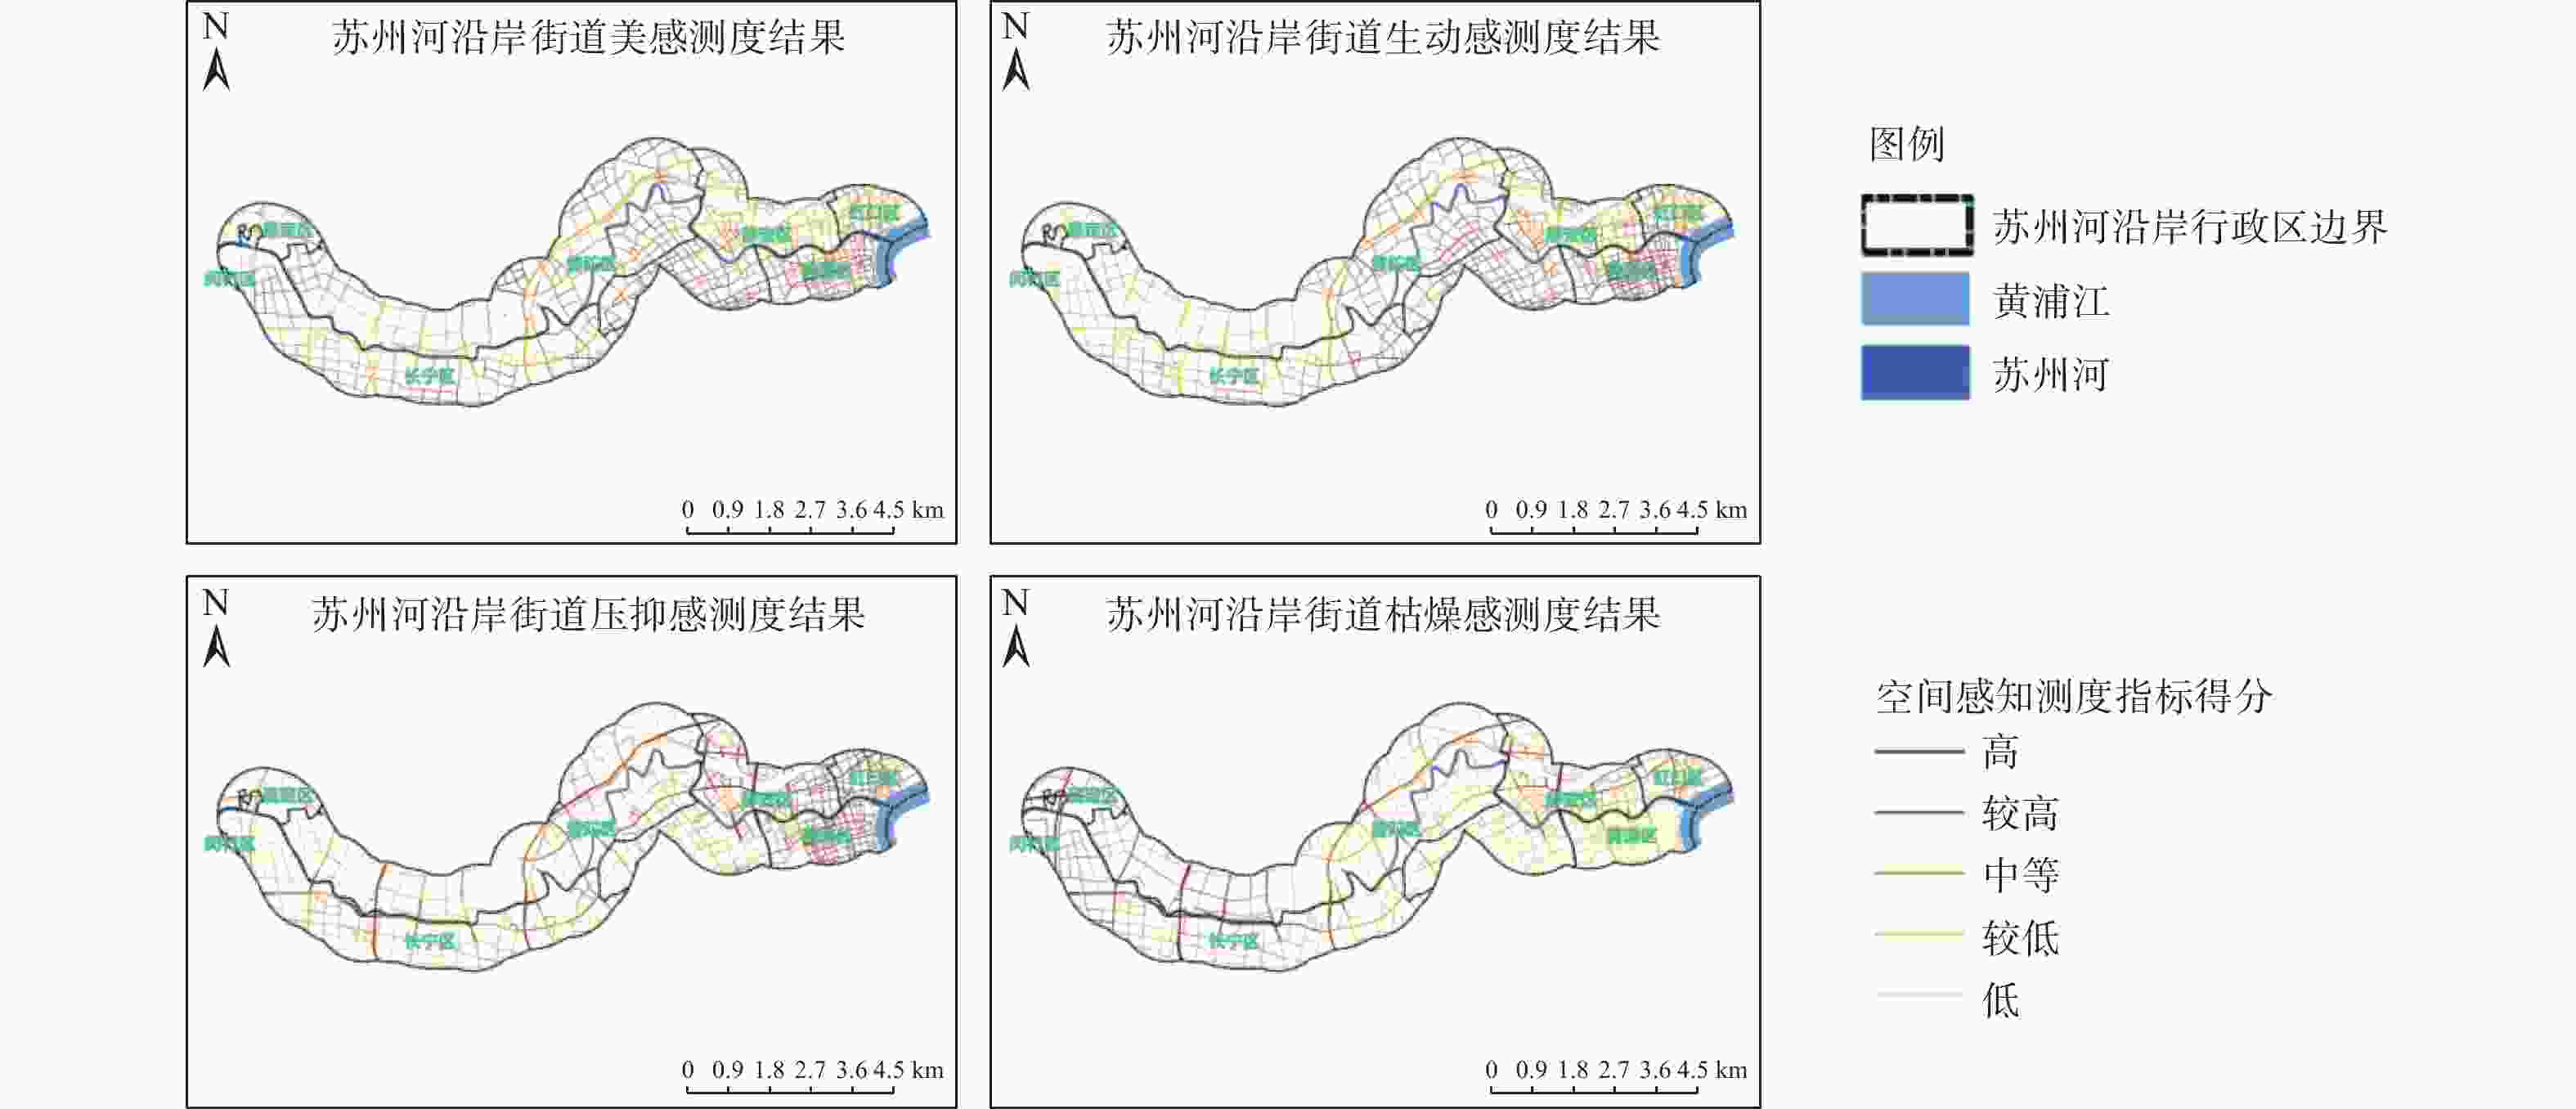
行政区 美感 生动感 枯燥感 压抑感 黄浦区 58.84 78.18 40.07 67.32 虹口区 46.24 60.44 54.16 67.63 静安区 46.59 61.55 53.58 63.05 普陀区 48.85 57.75 55.71 57.16 长宁区 44.85 53.56 60.12 58.56 全域均值 47.95 60.03 53.36 61.26 表 4 模型对比结果
Table 4. Model comparison result
模型 AICc 残差平方和 R2 R2adj OLS 4593.008 816.164 0.721 0.72 GWR 3754.204 465.449 0.841 0.819 MGWR 3478.247 394.794 0.865 0.841 表 5 回归系数差异
Table 5. Statistical table of regression coefficient differences
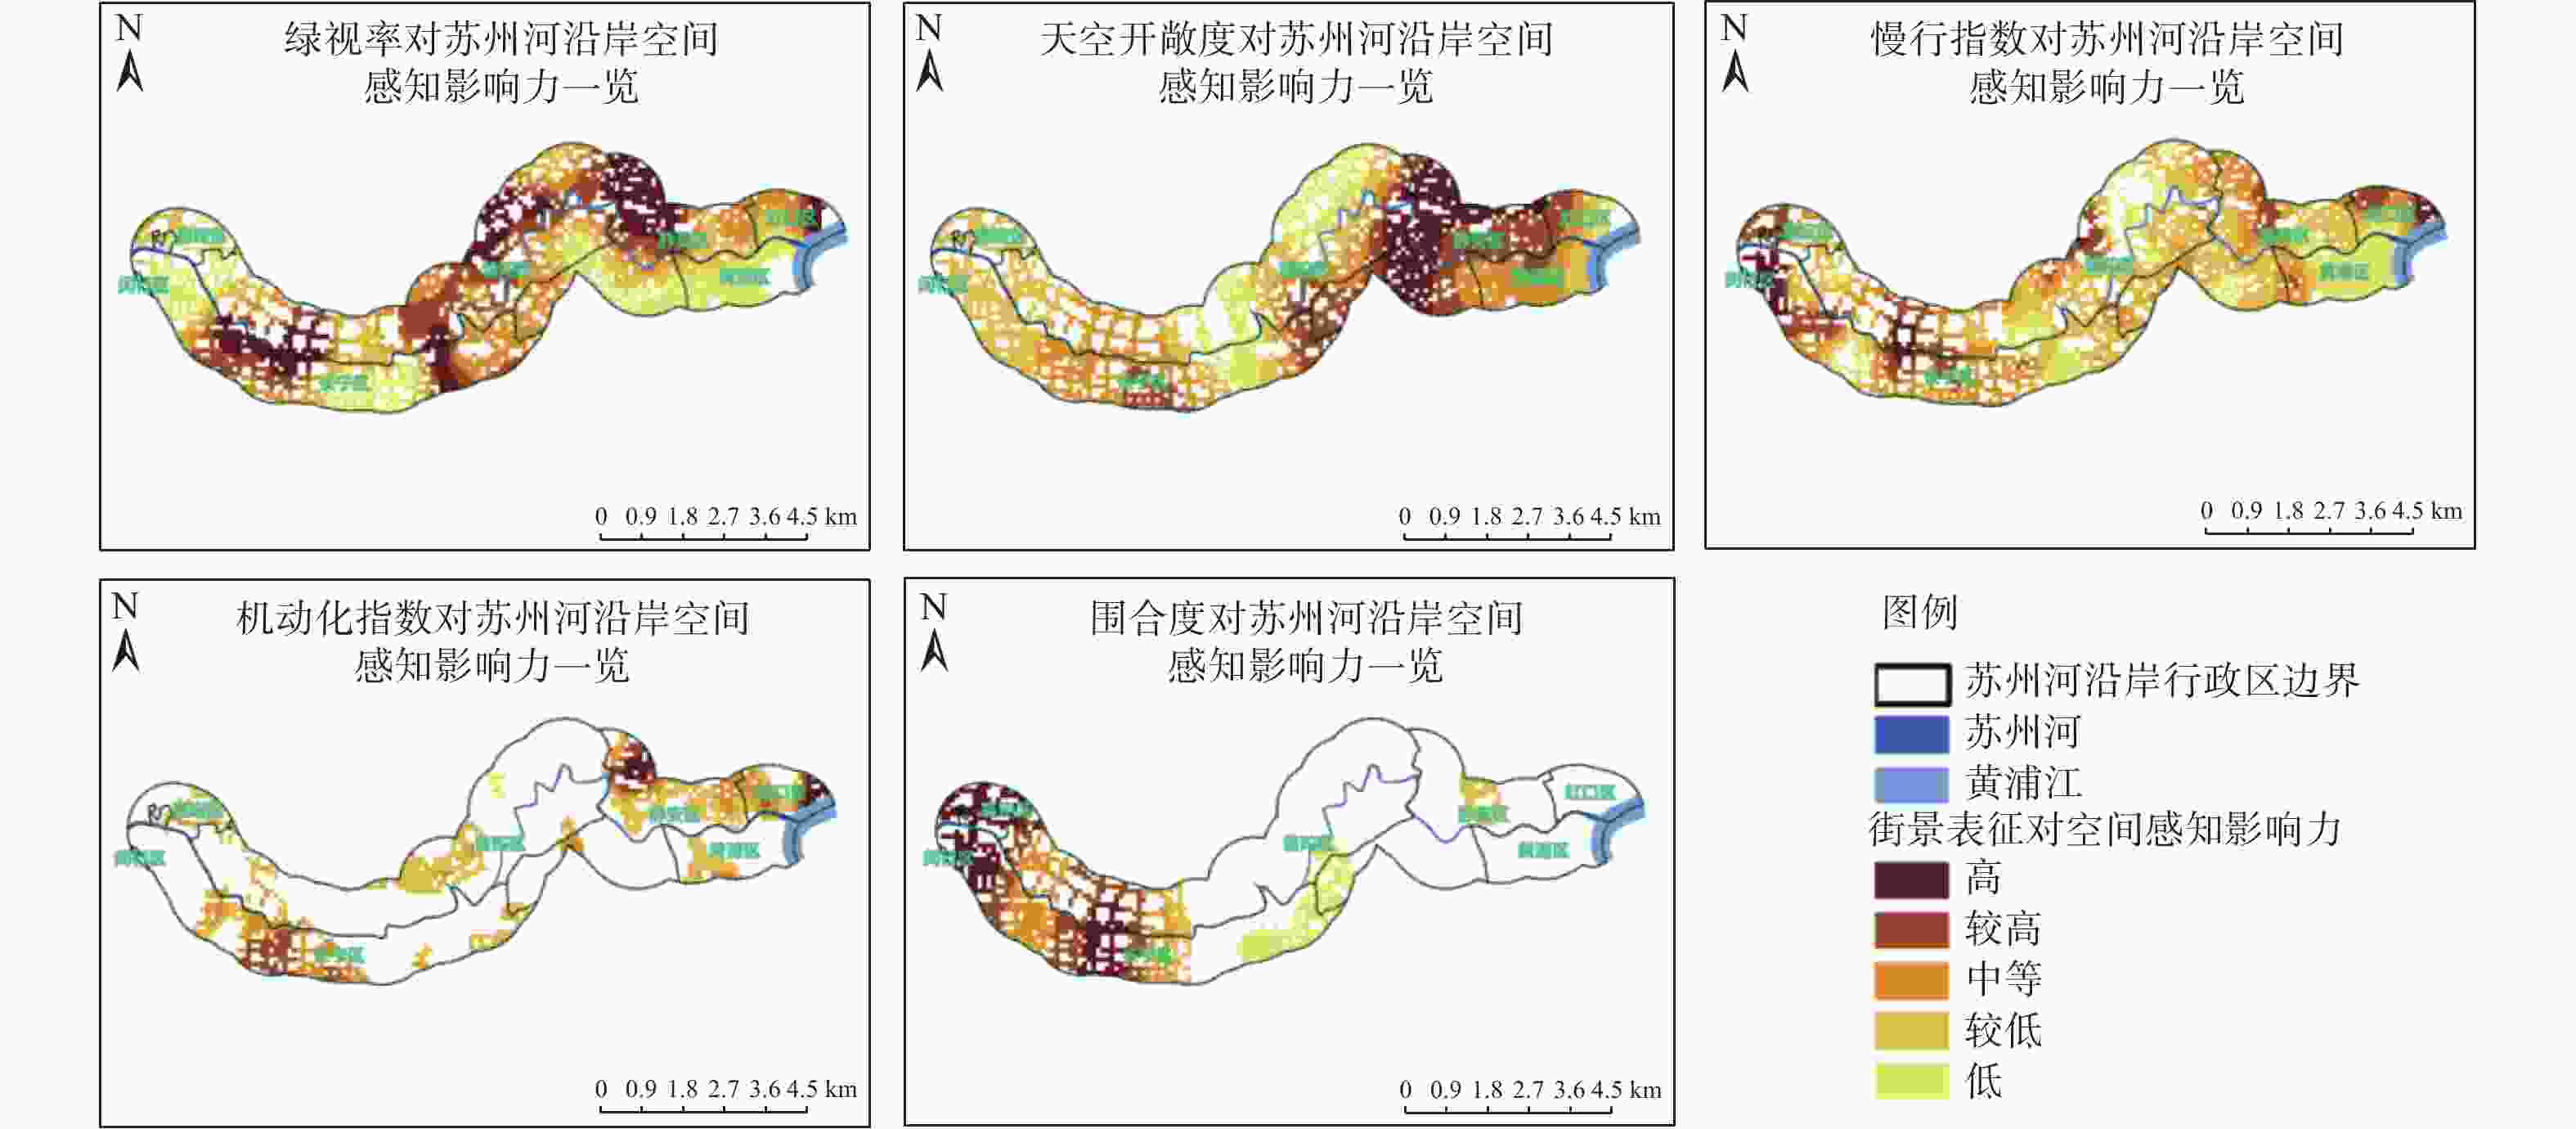
变量 带宽 均值 标准差 最小值 中位数 最大值 常数项 43 0.083 0.220 −0.723 0.082 0.683 天空开敞度 308 −0.200 0.066 −0.369 −0.201 −0.048 绿视率 221 0.487 0.091 0.213 0.514 0.644 机动化指数 91 0.090 0.101 −0.167 0.086 0.582 慢行指数 87 0.320 0.128 0.065 0.304 0.799 围合度 405 0.055 0.096 −0.090 0.023 0.249 休闲餐饮设施 110 0.184 0.135 −0.098 0.179 0.575 休闲购物商店 985 0.080 0.046 0.026 0.070 0.176 休闲文旅资源 2386 0.043 0.012 0.028 0.044 0.058 休闲娱乐场所 2925 0.035 0.003 0.031 0.034 0.038 休闲体育场馆 2081 0.003 0.011 −0.011 0.003 0.020 表 6 回归系数统计表
Table 6. Table of regression coefficient
自变量回归系数 虹口区 黄浦区 静安区 长宁区 普陀区 影响力显著
区域占全区
面积/%影响系数
均值影响力显著
区域占全区
面积/%影响系数
均值影响力显著
区域占全区
面积/%影响系数
均值影响力显著
区域占全区
面积/%影响系数
均值影响力显著
区域占全区
面积/%影响系数
均值天空开敞度 88.54 −0.19 100.00 −0.21 100.00 −0.22 100.00 −0.18 94.65 −0.17 绿视率 100.00 0.35 100.00 0.32 100.00 0.49 100.00 0.52 100.00 0.53 机动化指数 73.25 0.01 27.94 0.15 46.19 0.01 42.60 0.21 24.17 0.12 慢行指数 100.00 0.41 100.00 0.20 99.66 0.31 98.52 0.37 96.26 0.31 围合度 不显著 不显著 100.00 0.02 不显著 不显著 84.47 0.14 27.38 0.15 休闲餐饮设施 77.07 0.21 25.91 0.14 85.96 0.25 73.67 0.29 60.86 0.23 休闲购物商店 100.00 0.03 100.00 0.03 100.00 0.08 45.56 0.08 83.32 0.13 休闲文旅资源 100.00 0.06 100.00 0.05 100.00 0.05 100.00 0.03 79.57 0.04 休闲娱乐场所 100.00 0.03 100.00 0.03 100.00 0.03 100.00 0.04 100.00 0.04 -
[1] 苏婷, 刘玮辰, 吴巍, 等. 城市滨水区再开发的研究进展与展望[J] . 地理科学进展,2023,42(2):392 − 405. doi: 10.18306/dlkxjz.2023.02.015 [2] 林焰. 城市滨水开放空间景观的建设与保护[J] . 中国园林,2003(12):30 − 32. doi: 10.3969/j.issn.1000-6664.2003.12.008 [3] 曾旭东, 张振华. 基于区域生态优先的城市滨水景观规划设计: 以重庆嘉陵江草街滨江景观规划为例[J] . 中国园林,2010,26(8):49 − 53. doi: 10.3969/j.issn.1000-6664.2010.08.012 [4] 徐望朋, 卞晓俊. 城市滨水空间设计策略: 以上海嘉定远香湖地区为例[J] . 规划师,2014,30(S4):10 − 14. [5] 江浩波, 宋孟坤, 肖扬. 滨水空间视觉景观舒适度评价研究: 以上海市“一江一河”为例[J] . 风景园林,2022,29(10):122 − 129. [6] 魏鸿雁, 陶卓民, 潘坤友. 城市滨水区游憩空间与游憩活动的空间耦合特征及影响机制: 以南京秦淮河为例[J] . 长江流域资源与环境,2022,31(4):840 − 850. [7] 张洁, 俞青青, 傅东示, 等. 基于多源数据的城市滨水空间活力研究: 以杭州西湖滨水区为例[J] . 浙江林业科技,2023,43(4):82 − 89. doi: 10.3969/j.issn.1001-3776.2023.04.011 [8] 李敏, 李建伟. 近年来国内城市滨水空间研究进展[J] . 云南地理环境研究,2006(2):86 − 90. doi: 10.3969/j.issn.1001-7852.2006.02.018 [9] 上海市人民政府. 上海市国民经济和社会发展第十四个五年规划和二〇三五年远景目标纲要[EB/OL]. (2021−01−27)[2023−06−06]. https://www.shanghai.gov.cn/nw12344/20210129/ced9958c16294feab926754394d9db91.html. [10] 上海市人民政府新闻办. 市政府新闻发布会介绍《上海市“一江一河”发展“十四五”规划》相关情况[EB/OL]. (2021−08−21)[2023−06−06]. https://www.shanghai.gov.cn/nw12344/20210831/c543bb18cf454f01936e02499cf797cf.html. [11] YAO Y, LIANG Z T, YUAN Z H, et al. A human-machine adversarial scoring fram-ework for urban perception assessment using street-view images[J] . International Journal of Geographical Information Science,2019,33(12):2363 − 2384. doi: 10.1080/13658816.2019.1643024 [12] 刘智谦, 吕建军, 姚尧, 等. 基于街景图像的可解释性城市感知模型研究方法[J] . 地球信息科学学报,2022,24(10):2045 − 2057. doi: 10.12082/dqxxkx.2022.210712 [13] 芦原义信. 街道的美学(含续街道的美学)[M]. 尹培桐, 译. 武汉: 华中理工大学出版社, 1989: 29. [14] 高力. 基于街景图片识别的城市街道空间品质变化研究[D]. 北京: 北方工业大学, 2021. [15] 刘晨. 基于多源数据的街道空间步行适宜性评价方法优化研究[D]. 南京: 南京大学, 2020. [16] 胡昂, 戴维维, 郭仲薇, 等. 城市生活型街道空间视觉品质的大规模测度[J] . 华侨大学学报(自然科学版),2021,42(4):483 − 493. [17] DUBEY A, NAIK N, PARIKH D, et al. Deep learning the city: Quantifying urban perception at a global scale[C]//Proceedings of European Conference on Computer Vision (ECCV). Cham: Springer, 2016: 196−212. [18] 宋颖, 高明秀, 王佳凡, 等. 基于MGWR的滨海区土壤盐渍化分布空间预测及影响因素分析[EB/OL]. (2023−10−31)[2023−11−14]. https://link.cnki.net/doi/10.13227/j.hjkx.202307195 [19] 沈体雁, 于瀚辰, 周麟, 等. 北京市二手住宅价格影响机制: 基于多尺度地理加权回归模型(MGWR)的研究[J] . 经济地理,2020,40(3):75 − 83. [20] 谢涤湘, 吴淑琪, 常江. 邻避设施空间分布特征及其与周边住宅价格的关系: 广州案例[J] . 地理科学进展,2023,42(1):42 − 52. -


 下载:
下载:
