Statistical analysis and application of zero-and-one-inflated geometric distribution
-
摘要: 研究了0−1膨胀几何分布模型,构造隐变量的条件分布,并设计抽样算法。在数据扩充的基础上,运用极大似然估计、期望极大(expectation maximization,EM)算法及贝叶斯方法对模型参数进行估计。设定不同的样本量和参数真值,通过数值模拟对上述方法进行性能评估。最后,对1994年美国底特律交通事故死亡数据集进行分析,研究表明,0−1膨胀几何分布模型能够较好地对该数据集进行拟合。Abstract: Zero-and-one-inflated geometric distribution model was investigated, the conditional distribution of latent variables were constructed, and a sampling algorithm was designed. On the basis of data expansion, the maximum likelihood estimation, expectation maximization (EM) algorithm and Bayesian method were employed to estimate the model parameters. Different sample sizes and parameter true values were setted, and the performance of these methods were evaluated through numerical simulations. Finally, the Detroit traffic accident deaths dataset in 1994 of United States were analyzed, the results indicate that zero-and-one-inflated geometric distribution model can fit the dataset better.
-
表 1 参数估计量的均值
Table 1. Mean of parameter estimators
参数 MLE MLE(EM) Bayes $ \theta $ $ p $ $ q $ $ n $ $ {\theta _M} $ $ {p_M} $ $ {q_M} $ $ {\theta _E} $ $ {p_E} $ $ {q_E} $ $ {\theta _B} $ $ {p_B} $ $ {q_B} $ 0.3 0.3 0.4 200 0.306 0.278 0.386 0.324 0.338 0.415 0.275 0.274 0.364 500 0.295 0.286 0.390 0.313 0.327 0.394 0.291 0.283 0.387 0.6 200 0.302 0.271 0.587 0.319 0.286 0.573 0.283 0.285 0.575 500 0.296 0.282 0.593 0.305 0.291 0.586 0.288 0.294 0.588 0.7 0.4 200 0.282 0.675 0.378 0.323 0.662 0.361 0.281 0.656 0.365 500 0.294 0.712 0.417 0.309 0.681 0.386 0.287 0.685 0.382 0.6 200 0.317 0.734 0.584 0.285 0.665 0.576 0.313 0.721 0.581 500 0.293 0.717 0.590 0.291 0.684 0.588 0.306 0.709 0.585 0.8 0.3 0.4 200 0.754 0.265 0.353 0.726 0.271 0.354 0.763 0.287 0.463 500 0.786 0.286 0.382 0.762 0.284 0.386 0.787 0.291 0.486 0.6 200 0.722 0.275 0.577 0.779 0.279 0.548 0.761 0.283 0.576 500 0.781 0.282 0.582 0.786 0.282 0.588 0.792 0.292 0.587 0.7 0.4 200 0.786 0.637 0.368 0.756 0.718 0.367 0.783 0.687 0.376 500 0.792 0.668 0.382 0.788 0.711 0.375 0.790 0.693 0.384 0.6 200 0.776 0.686 0.564 0.772 0.728 0.578 0.784 0.685 0.564 500 0.783 0.695 0.589 0.792 0.708 0.590 0.791 0.694 0.593 表 2 参数估计量的均方误差
Table 2. MSE of parameter estimators
参数 MLE MLE(EM) Bayes $ \theta $ $ p $ $ q $ $ n $ ${\theta _{\rm{M}}}$ ${p_{\rm{M}}}$ ${q_{\rm{M}}}$ ${\theta _{\rm{E}}}$ ${p_{\rm{E}}}$ ${q_{\rm{E}}}$ ${\theta _{\rm{B}}}$ ${p_{\rm{B}}}$ ${q_{\rm{B}}}$ 0.3 0.3 0.4 200 0.124 0.275 0.299 0.082 0.123 0.093 0.072 0.142 0.118 500 0.067 0.229 0.278 0.033 0.108 0.092 0.032 0.105 0.093 0.6 200 0.121 0.271 0.392 0.074 0.109 0.127 0.064 0.114 0.094 500 0.068 0.232 0.361 0.034 0.113 0.159 0.023 0.076 0.059 0.7 0.4 200 0.212 0.313 0.198 0.136 0.112 0.126 0.060 0.244 0.064 500 0.107 0.297 0.164 0.085 0.109 0.115 0.046 0.115 0.056 0.6 200 0.205 0.307 0.278 0.122 0.218 0.189 0.053 0.098 0.091 500 0.114 0.293 0.253 0.081 0.196 0.109 0.048 0.073 0.084 0.8 0.3 0.4 200 0.114 0.085 0.143 0.074 0.071 0.154 0.113 0.187 0.133 500 0.093 0.044 0.134 0.068 0.056 0.134 0.086 0.143 0.126 0.6 200 0.122 0.055 0.141 0.058 0.021 0.148 0.121 0.124 0.131 500 0.091 0.038 0.122 0.023 0.018 0.129 0.091 0.117 0.127 0.7 0.4 200 0.084 0.067 0.142 0.154 0.082 0.043 0.087 0.163 0.141 500 0.069 0.042 0.138 0.108 0.068 0.035 0.067 0.144 0.137 0.6 200 0.054 0.064 0.094 0.128 0.032 0.078 0.076 0.118 0.162 500 0.049 0.034 0.089 0.113 0.029 0.062 0.057 0.115 0.149 表 3 3种方法下参数的点估计
Table 3. Point estimation of parameters under three methods
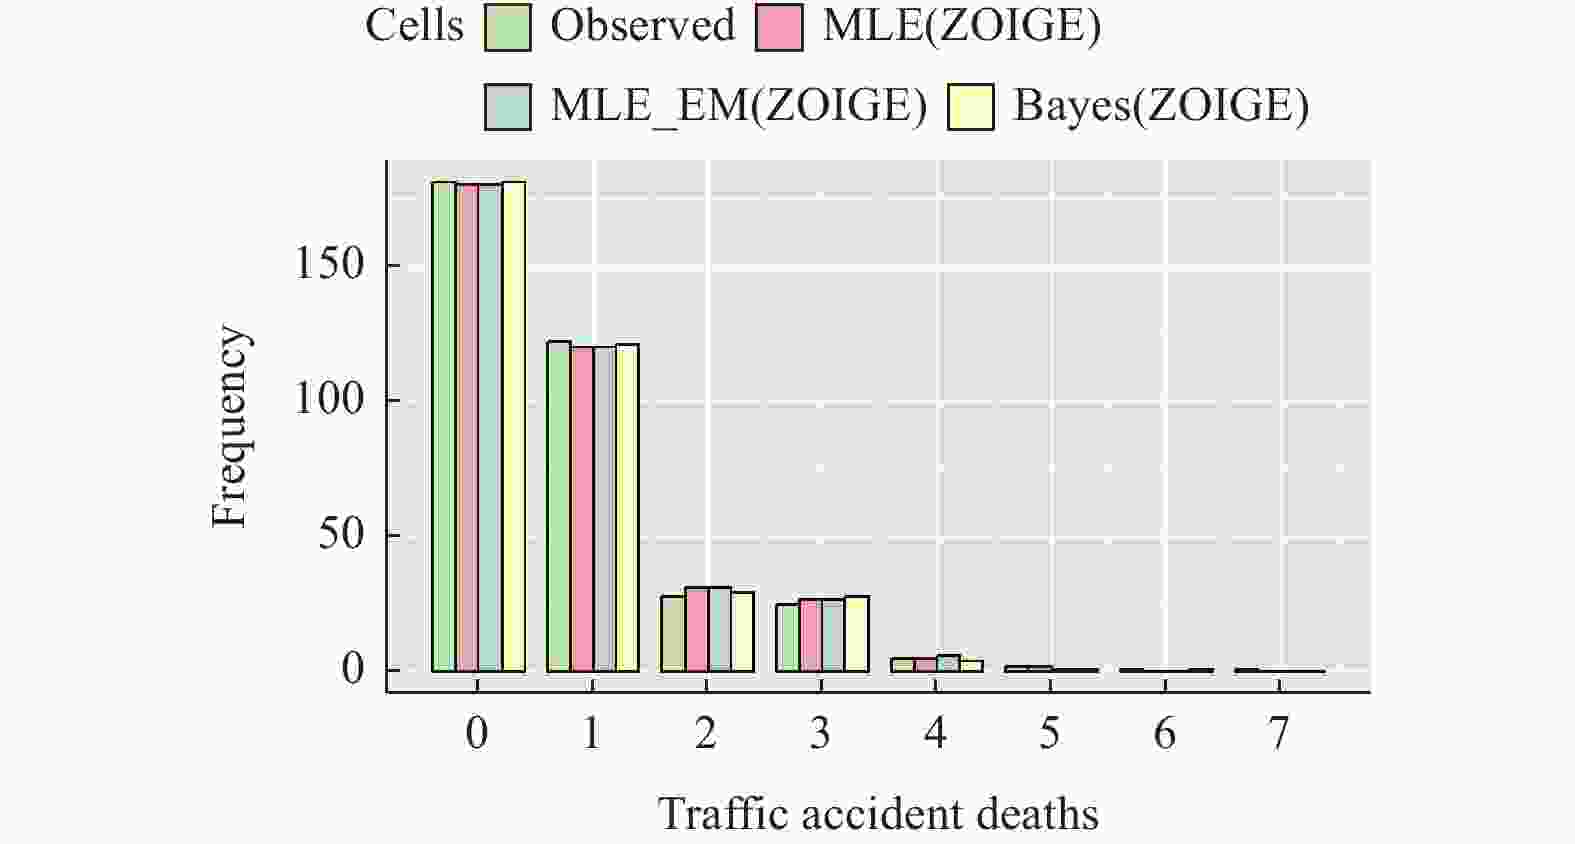
参数 MLE MLE(EM) Bayes $ \theta $ 0.0131 0.0131 0.0127 $ p $ 0.6830 0.6804 0.6616 $ q $ 0.6485 0.6490 0.6515 AIC 670.0665 668.0072 660.273 表 4 3种方法下观测值与拟合值的比较
Table 4. Comparison of observed and fitted values under three methods
观测值 观测频数 MLE MLE(EM) Bayes 0 181 180 180 181 1 122 120 120 121 2 28 31 31 29 3 25 27 27 28 4 5 5 6 4 5 2 2 1 1 6 1 0 0 1 7 1 0 0 0 -
[1] 张良超, 周金亮, 温利民. 零膨胀泊松模型中风险参数的贝叶斯估计[J] . 江西师范大学学报(自然科学版),2020,44(3):269 − 274. doi: 10.16357/j.cnki.issn1000-5862.2020.03.10 [2] 肖翔, 刘福窑. 零膨胀几何分布的参数估计[J] . 上海工程技术大学学报,2018,32(3):267 − 271,277. doi: 10.3969/j.issn.1009-444X.2018.03.013 [3] ZHANG C, TIAN G L, NG K W. Properties of the zero-and-one inflated poisson distribution and likelihood-based inference methods[J] . Statistics and Its Interface,2016,9(1):11 − 32. doi: 10.4310/SII.2016.v9.n1.a2 [4] TANG Y C, LIU W C, XU A C. Statistical inference for zero-and-one-inflated poisson models[J] . Statistical Theory and Related Fields,2017,1(2):216 − 226. doi: 10.1080/24754269.2017.1400419 [5] JORNSATIAN C, BODHISUWAN W. Zero-one inflated negative binomial-beta exponential distribution for count data with many zeros and ones[J] . Communications in Statistics: Theory and Methods,2022,51(24):8517 − 8531. doi: 10.1080/03610926.2021.1898642 [6] TAJUDDIN R R, ISMAIL N, IBRAHIM K, et al. A new zero–one-inflated poisson–lindley distribution for modelling overdispersed count data[J] . Bulletin of the Malaysian Mathematical Sciences Society,2022,45(1):21 − 35. [7] XIAO X, TANG Y C, XU A C, et al. Bayesian inference for zero-and-one-inflated geometric distribution regression model using Pólya-Gamma latent variables[J] . Communications in Statistics - Theory and Methods,2020,49(15):3730 − 3743. doi: 10.1080/03610926.2019.1709647 [8] 肖翔, 古晞. 0–1膨胀几何分布的客观贝叶斯分析[J] . 上海工程技术大学学报,2021,35(3):266 − 271. [9] WU C F J. On the convergence properties of the EM algorithm[J] . The Annals of Statistics,1983,11(1):95 − 103. -


 下载:
下载:


